We applied our DETANGLE analysis suite to the Corona-Warn-App for iOS and Android to assess the quality and other risks related to maintainability and extensibility. Up to version 1.11, we determined how features and defects are reflected in the code, measured architecture quality, estimated technical debt and analyzed knowledge distribution risks.
First of all, we would like to express our appreciation in all clarity for what has been achieved with the creation of the Corona-Warn-App. The overall system was developed under high media attention, tight time frames, political pressure and very high data protection requirements. With this blog, we would now like to point out quality aspects and risks that, in our view, should be given attention after an initial development stage.
Although the current code quality metrics from SonarQube, the tool used for code analysis during the development of the Corona-Warn-App, repeatedly show a very good rating for both apps up to version 1.11, there are nevertheless striking findings that contradict this good picture in parts. In this post, we will look at the results for the iOS-version of the app.
More on the Corona-Warn-App in the second part of the blog: Rethinking (Collective) Code Ownership – Knowledge Distribution Risks Demonstrated With the German Corona-Warn-App
More on technical debt here: The Most ‘Striking’ Way To Explain Technical Debt – Even to Your Kids & Managers
Take-Aways
1. Less Development Effort for Features, More for Bug-Fixing
When looking at the distribution of effort for features, bugs and other work, it is noticeable that in Q4/2020 and Jan/2021 the development effort for features fell below 60% of the total effort in 3 out of 4 months (incl. January 2021). Conversely, the maintenance effort in the form of bug-fixing increased to 20% of the total effort in 2 out of 4 months (incl. January 2021).
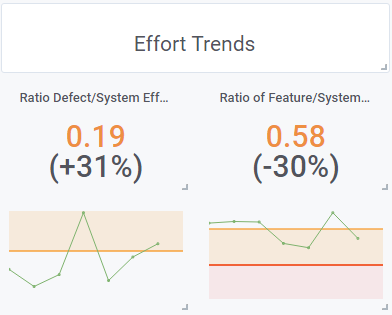
Figure 1: July 2020 to January 2021; left: Share of bug-fixing effort in total effort; right: share of feature development effort in total effort
These are not yet extremely worrying effort distributions, but they could be early indicators of a strengthening trend of declining feature throughput.
For an explanation of the measurement of development effort, see [2].
2. Feature-Debt Exceeded Warning Level in Q4/2020
Using DETANGLE’s architecture quality metrics, however, the extent of feature-coupling and feature-cohesion found in the code shows the time pressure under which the first versions of the apps had to be developed. In the releases over the summer months in the third quarter of 2020, a decrease in technical debt, as we measure it, was recognizable. But from version 1.7 and up to version 1.11, we believe a warning value of the measured feature-debt-index was reached again in the fourth quarter of 2020
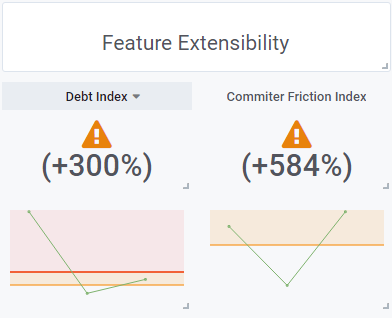
Figure 2: Quarter 2, 2020 – Quarter 4,2020; left: feature-debt-index (FDI) over the last 3 quarters of 2020
For explanations of feature-coupling, feature-cohesion and the feature-debt-index, see [1] and [3].
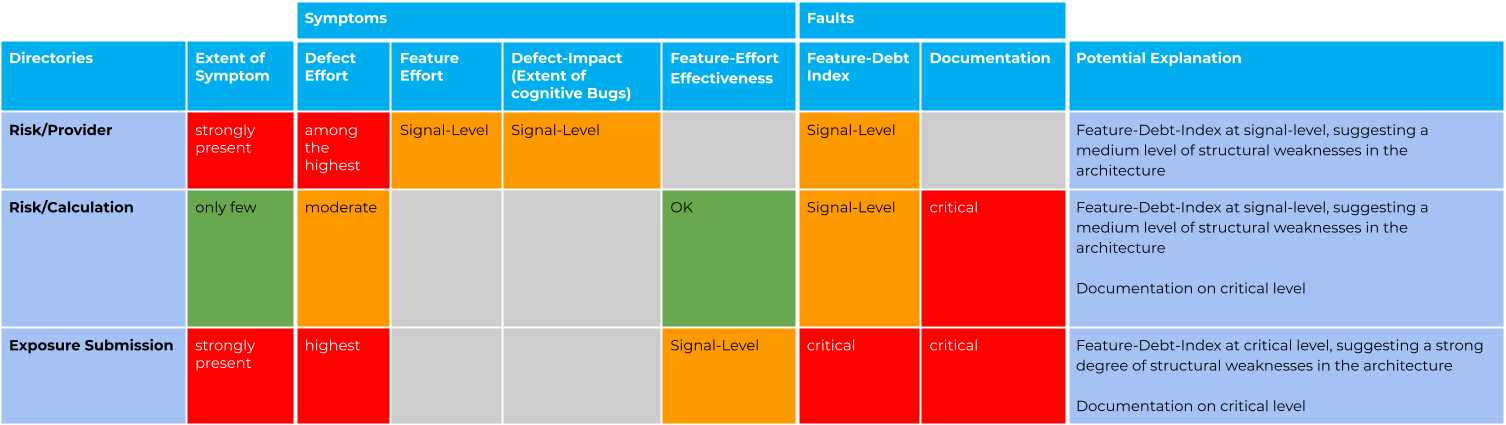
3. Architecture Quality of Three Feature Blocks Indicate Need for Action
For example, there is an increasing need for action with regard to the architectural quality of the code modules, where the following features have been implemented:
- The multiple risk calculation per day with version 1.7 from Oct/2020 using 30min time windows for the exposure detection of matches of encounters with the downloaded anonymous diagnosis keys of Covid sufferers.
The corresponding Github Issues/PRs can be found mainly by searching for the keywords “risk calculation” and “download packages”.
- The more accurate risk assessment with version 1.9 from Dec/2020, so that several individual encounters with low risk (green) can lead to increased risk (red).
These GitHub Issues/PRs can essentially be found under the keyword “risk calculation”.
- The improved processes for retrieving and reporting a test result.
Many of these GitHub Issues/PRs have the keyword “exposure submission” in the title.
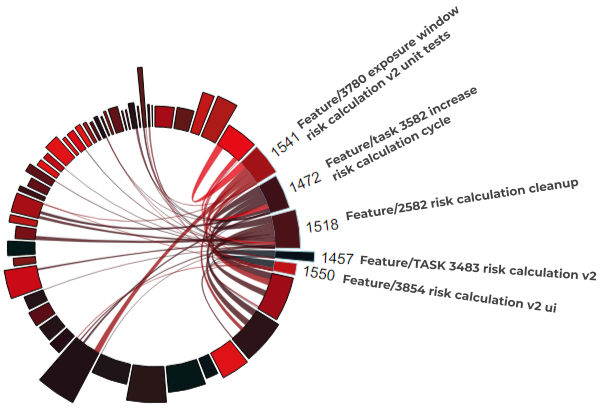
Figure 3: Coupling of the risk calculation features (1472, 1457, 1518, 1541, 1550) to other features (not numbered arcs) from Quarter 4, 2020
Figure 3 shows all GitHub Issues/PRs from the 4th quarter of 2020 as individual arcs on a circle. A link between two arcs represents the coupling between two features. The numbered arcs on the right represent the more accurate risk calculation features from V1.9. The connections clearly suggest that these features are not only interwoven with each other, but with many other implemented features from Q4. The more extensive the coupling among unrelated features, the more difficult it becomes to add new features to the code base without unintended side effects.
From our point of view, we expect other types of risk calculations, such as potentially for visits to restaurants that provide a QR code for scanning, to find their way into the app. However, this in turn is likely to lead to a sharp increase in maintenance work in the form of bugs due to the decreasing extensibility of these features from V1.9 or the addition of new features to this code without refactoring.
4. Source Code Folders With High Feature-Debt
We were able to assign the above-mentioned feature clusters to the respective code areas with an increased feature-debt- index in Fig. 4.
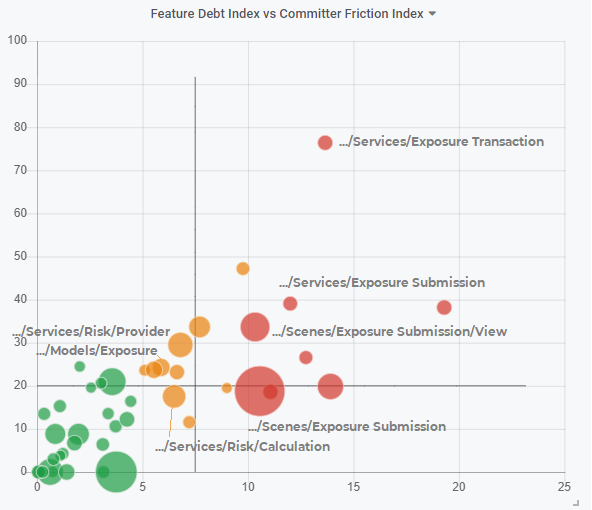
Figure 4: Source code folders; feature-debt-index on the x-axis; committer-friction-index on the y-axis (not relevant here)
These are essentially the following source code folders:
src/xcode/ENA/ENA/Source/Services/Exposure Submission
src/xcode/ENA/ENA/Source/Scenes/Exposure Submission
src/xcode/ENA/ENA/Source/Scenes/Exposure Submission/View
src/xcode/ENA/ENA/Source/Services/Exposure Transaction
src/xcode/ENA/ENA/Source/Models/Exposure
src/xcode/ENA/ENA/Source/Services/Risk/Provider
src/xcode/ENA/ENA/Source/Services/Risk/Calculation
Figure 4 shows the values of the feature-debt-index for folders on the x-axis (the y-values represent the committer-friction-index (CFI), which will be discussed in one of the next blogs). The Lines of Code of the folders are displayed by the size of the bubbles. The Exposure Submission folders mentioned above fall under the largest red folders, while again the Risk folders represent the largest two yellow bubbles. These directories account for approximately 20% of the code base and have grown by 50% to 150% each in Q4/2020.
5. Decreasing Source Code Documentation
The source code documentation of the entire code base has fallen to a low value of 9% (of comments in source files compared to their non-empty lines of source code) in the last three months until the end of Jan 2021. In particular, some of the source code folders considered critical above show critical values of 9%. Thus, there is a combination of architectural weaknesses and lack of code comprehensibility due to low code documentation in these folders.
6. Critical Source Code Folders Have Impact
Consequences in the above-mentioned directories are already evident in:
1. A necessary but feasible reduction of the technical debt:
The current maintenance effort is already much higher than the technical debt, by which we mean the estimated effort to improve the quality of the architecture. It is therefore worthwhile to start refactoring here, especially since the improvement effort would correspond to about one man-week in terms of the average effort per month for the last quarter Q4/2020.
2. A currently high feature-effort-effectiveness-index:
The effort required to develop new features is already accompanied by an increased refactoring effort to implement them.
7. Increased Feature Debt Also in test-Folders
Some of the corresponding test-folders for the above source code directories also have critical feature-debt-index values. This means that they are just as interwoven with regard to the implemented features as the code to be tested, so that adding tests for new features is also likely to involve additional work in the sense of refactoring.
8. Restricted Access to Project Issues
Due to the sole access to the GitHub projects and without access to the tickets of the non-public SAP JIRA Issue Tracker, we can only deliver valid results for the iOS app.
The reasons are discussed in more detail below. To make matters worse, capturing bugs, features and their referring to them in commits during development was handled very differently within the iOS and Android app over the course of the project.
However, in order to make our findings on the Corona warning app development optimally usable for both apps, we would need read access to the tickets of the non-public SAP JIRA EXPOSUREAPP project beyond the public Github projects.
9. Get User Feedback on Features?
We would like to make a suggestion as a final “take-away”. There are 25 million app users. This is an opportunity not to be underestimated to collect anonymous feedback; be it for reporting bugs or for voluntary surveys when using the app by collecting feedback on potential new (or ongoing) features. It could even be used to gather opinions on feature options, which could then be taken advantage of to base further development decisions on.
Outlook – Risks of Knowledge Distribution

Due to the scope, we have not yet been able to address the following questions in this blog:
- What does the organisation or self-organisation of the development look like?
- Are there stability anchors of developers who constantly work on the app or the system? Is the software knowledge about the apps well distributed?
- Do the developers work well together so that the team develops effectively?
- Or does the cooperation involve certain risks and lead to quality problems such as an increased density of errors?
The next parts of the blog series will seek answers to these questions and look at the risks in the distribution of knowledge for the development of the Corona iOS app.
Now the following aspects will be covered in this first part of the blog series:
- how we proceeded with the analysis using access to the Github data but without access to the JIRA tickets
- how we arrived at the above results
- what recommendations we would make in detail to reduce technical debt and counter the erosion of feature extensibility
Another Analysis – Why?
In software development, it is common practice to measure software quality using metrics of code quality. SonarQube has almost established itself as an “industry standard” among developers to detect potential bugs or code smells in the code, for example. The tool also offers an estimate of the technical debt measured in terms of the effort required to eliminate the findings in question.
SonarQube was therefore also used throughout the development of the two Corona Warn apps. SonarQube’s metrics for code quality have indicated very good ratings for both Corona Warn apps with the last versions.
It is well known, however, that code quality is not everything. The question of architecture quality is at least as relevant!
Specifically, one wants to know to what extent the architecture of the two apps enables the development of new features or the extension of existing functionality. Current approaches often assess good architecture quality along certain patterns of structural dependency graphs such as call hierarchies and cycles between code modules. The informative value of these assessments is only of limited relevance when it comes to the question of how far the current architecture enables the development of new features [4].
We therefore used the DETANGLE Analysis Suite to analyse the development of the apps based on the history of the GitHub code repositories and the GitHub issues and pull requests with regard to architecture quality and derived prioritised recommendations for action to keep maintenance costs (in form of bug fixing) in check due to technical debt and to restore the feature extensibility of the iOS app in certain (from our point of view) future relevant code areas.
About the Approach
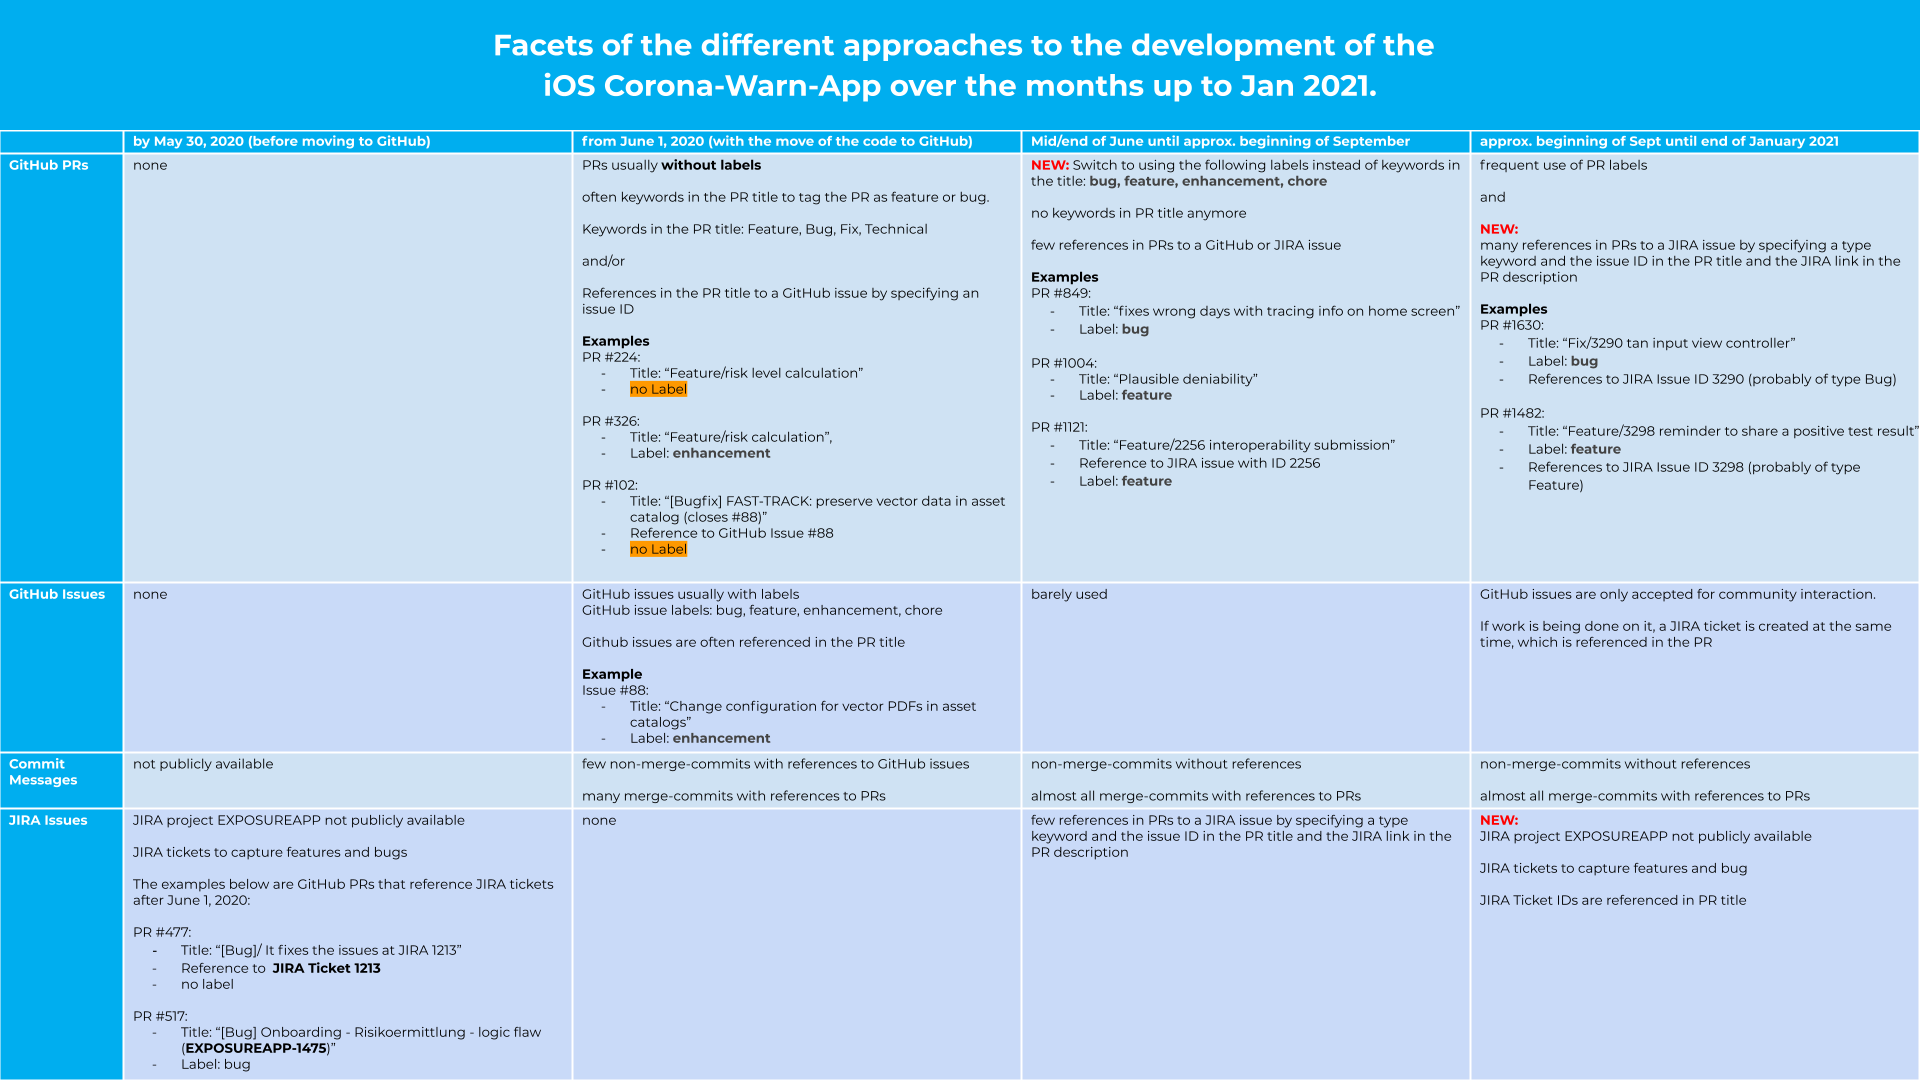
The capturing of bugs, features and their referencing during the development of the code was handled differently over different time periods in the course of the project using GitHub issues, GitHub pull requests (PRs) and JIRA tickets of the SAP-internal JIRA EXPOSUREAPP project. After the switch to the public GitHub project, pull requests were used among the developers in a not quite appropriate way to capture features and bugs. Pull requests are a means of organizing joint coding work in the repository and should not be used for requirements engineering. [5]
The following table summarizes the facets of the different approaches to iOS app development over the months up to January 2021.

Our approach to determine features and bugs (and code changes resulting from them) was to derive their type, such as “feature”, “enhancement” and “bug”, from labels and keywords of GitHub PRs and issues. More details can be found in the appendix.
Determining the GitHub PR/issue types has been even more difficult for the Android version of the app, as there are significantly fewer PRs with labels and identifiable keywords, which is especially true for the months of 2020 through September. This can also be seen in the percentage of development effort for features, enhancements and bugs captured by DETANGLE. For the iOS app, over 70% of the development effort measured by DETANGLE could be attributed to the said types, while for Android development it accounts for just under 50% of the development effort. Therefore, we can only claim valid statements for the Corona iOS app development.
Regardless of the circumstances of the analysis, we hope that the approach emerging in Q4 will establish itself for the development of further versions. The procedures for the iOS and Android app still show certain differences, which we will not go into here. For both approaches, however, the use of the non-public SAP JIRA ticketing system makes the further development of the app appear intransparent to a certain extent.
Feature-Coupling and Feature-Effort – Be in The Know Without Code Knowledge
Fortunately, conclusions about the architecture quality can be drawn by the mere observation of the features of a version, without requiring the reader to have knowledge about the code. With a suitable visualization of feature coupling, it can be determined to what extent related features affect the same code locations or whether they already scatter across the code base and are interwoven via a high intersection with the code locations of other “foreign” features in the code.
This opens up space for discussions between those responsible for the product and the engineers, architects and developers about the quality of the architecture in connection with the future relevance of features. If certain features (e.g., risk calculation) are expected to have extensions or variations whose feature coupling across the code base is evidently high a quick and informed decision can be made by all stakeholders to take prioritized refactoring actions of the code behind these features first.
In the following we look at the related features for the respective versions V1.7 to V1.11 as examples. For “didactic” reasons we start with V1.10, come back to V1.11 and then move on to V1.9 to V1.7.
Feature-Set in V1.10: Contact Diary
The defining feature set of version 1.10 [8] was the contact diary, in which the user can record his contacts to people and the meeting place and trace them back over two weeks.
GitHub PRs that we were able to assign to the version as features (or parts of it; keywords: “diary”, “legal” and “journal”):
- #1720: Feature/4199 contact journal UI tests
- #1707: Feature/task 4259 info screen legal texts
- #1701: Feature/4232 diary unit test
- #1694: Feature/3917 contact diary (STORY merge, already reviewed code)
- #1687: Feature/4174 diary edit entries screen
- #1676: Feature/3917 4180 contact diary persistence
- #1670: Feature/4172 diary day screen
- #1651: Feature/4171 diary overview screen
The following diagram takes a look at these features. Each arc along the circle represents a feature (= GitHub issue / PR). The width of an arc shows the spent feature-effort.
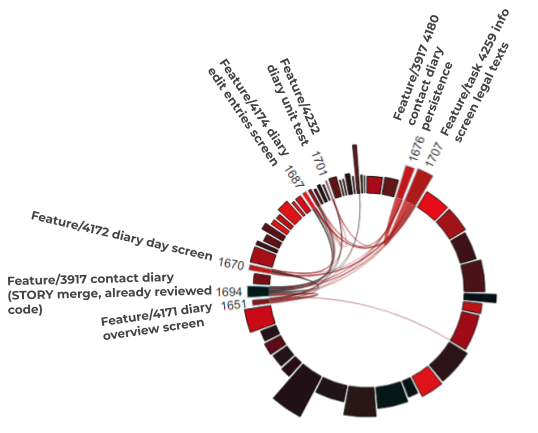
Figure 5: Purely local feature-coupling in V1.10
The following conclusions can already be drawn visually:
- Two of the numbered features have a high effort, which indicates a medium-large effort of this feature set in total.
- The features of version 1.10 are almost completely coupled only with each other. It is therefore a purely local coupling based on new code. There is only one coupling to an existing feature from another version.
- The strong coupling of the features from version 1.10 among themselves appears unproblematic. Even with good architecture quality, it can be seen as a normal phenomenon: such couplings can certainly occur when implementing a new feature set up to the development of a consolidated code design.
Feature-Set in V1.11: Statistics
The defining feature set of version 1.11 [7] was the provision of various nationwide statistics published by the Robert Koch-Institute and their trends, such as the number of infected persons or the R-value.
GitHub PRs that we were able to assign to the version as features (or parts of it):
- #1829: Feature/3411 statistics
- #1825: Feature/task 4610 statistics app store screenshot
- #1820: Feature/task 3411 UI tests for statistics
- #1807: enhancement fetch & cache statistical dat
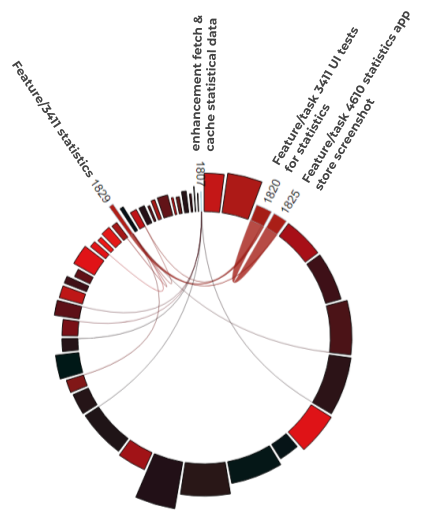
Figure 6: Slight non-local feature-coupling in V1.11
Compared to version 1.10, this feature set does not show only pure local feature-coupling of the features to each other. There is some, but not excessive, coupling to other unrelated features.
Let’s continue now with version 1.9, which shows a completely different picture.
Feature-Set in V1.9: Risk Assessment and Exposure Submission
Version 1.9 [9] mainly consisted of the calculation of a more accurate risk assessment in case of multiple “low-risk” encounters. Furthermore, the process of handling a test result was improved. The GitHub issues/PRs for the first feature set are listed under the keyword “risk calculation”, those for the second under the keywords “submission” and “result”.
Keyword “risk calculation”:
- #1550: Feature/3854 risk calculation v2 ui
- #1541: Feature/3780 exposure window risk calculation v2 unit tests
- #1518: Feature/2582 risk calculation cleanup
- #1457: Feature/TASK 3483 risk calculation v2
Keyword “submission” and “result”:
- #1626: Feature/task 4045 adjust exposure submission service
- #1583: Feature/3758 test result available cell
- #1562: Feature/3516 user consent switch automatic result sharing
- #1561: Feature/task 3630 testresult available
- #1319: feature Add new qr code information screen #2968
Figure 7 shows the iris diagram for the first feature set of the more accurate risk assessment:
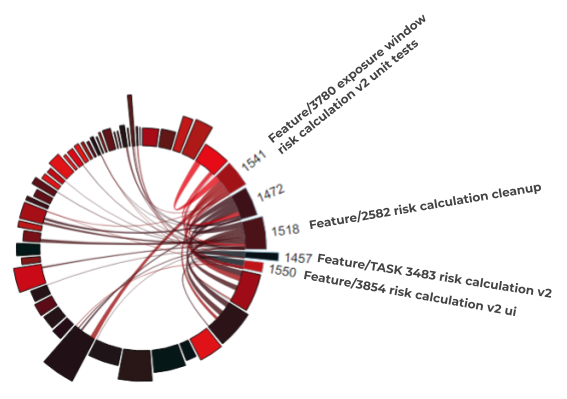
Figure 7: Widespread feature-coupling of the risk calculation in V1.9
There is a sharp contrast to the picture for version 1.10 and 1.11. The following conclusion can already be drawn from a purely visual perspective: all features (numbered arcs) of the feature set are broadly coupled with many other non-related features (unnumbered arcs) over the code base, although their total effort is to be seen in the middle range.
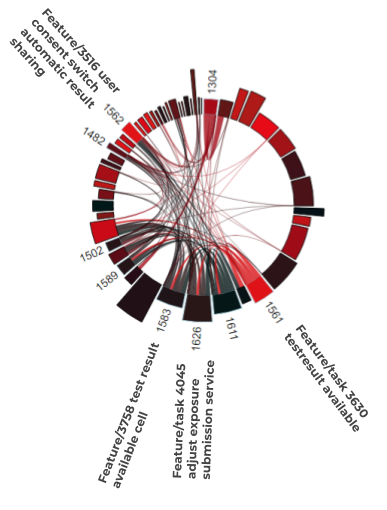
Figure 8: Strongly scattered feature-coupling of the Corona test procedure feature-set in V1.9
A similar, even more intensified, picture of the local AND global feature coupling (with a high overall effort) results from the second feature set of the improved process for handling corona test results by the users.
Finally, let’s take a look at the picture in version 1.7.
Feature-Set in V1.7: Multiple Risk Calculation
In Version 1.7 [10] (we couldn’t identify version 1.8, by the way), the feature-set of multiple risk checks per day and the GitHub issues/PRs behind it, which can be found under the keywords “package”, “download” and “cycle”, are of interest.
Keywords “package“ and “download”:
- #1490: Feature/task 3611 risk detection only when new packages
- #1489: Feature/task 3667 dm disable hourly packages download
- #1483: Feature/task 3498 DM for hourly packages wifi mode toggle
- #1472: Feature/TASK 3582 increase risk calculation cycle
- #1468: Feature/Task 3583 Download Hour Packages on WiFi Only
- #1465: Feature/task 3497 download packages
- #1482: Feature/3298 reminder to share a positive test result
Figure 9 shows a moderate feature-coupling of the feature-set of the multiple risk calculation to other unrelated features.
Figure 9: Feature-coupling of risk detection in V1.7
However, if we add the feature set for more accurate risk assessment from version 1.9, Figure 7 and Figure 9 merge into one picture in Figure 10. It can be concluded that these two feature sets from the two different versions, which both affect the code area of risk calculation, are very strongly coupled with each other.
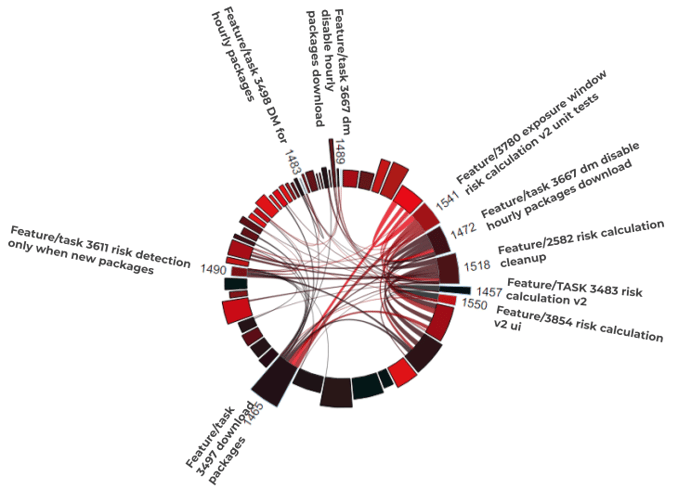
Figure 10: Feature-coupling of risk detection and assessment in V1.7 and V1.10
Let us summarize the following conclusions:
- Features of a feature-set from one version can be strongly coupled with each other, since the implementation of a new feature-set requires a certain consolidation of the design. This case, e.g. in the contact diary from V1.10, is not a problem.
- In the case of a widespread coupling of features of a feature-set to many other unrelated, “foreign” features, these features indicate code locations which in turn point to structural weaknesses in the architecture.
- The more extensive the coupling among unrelated features, the more difficult it becomes to add new features to the code base without unintended side effects.
- Therefore, it’s important to identify those code areas behind the broadly coupled feature-sets, which in turn have high coupling values and a high feature-quality-debt index.
The next step is to examine these source code directories and source code files more closely in order to derive recommendations for action.
Affected Code Areas
Table 1 below lists the source code directories with critical feature-debt-index (FDI) values. It refers to Figure 4 and presents the same information in the form of quantified values. For easier comparison, we have shown Figure 4 here again before the table
Figure 11 (like Figure 4): Source code folders; feature-debt-index on the x-axis; committer-friction-index on the y-axis (not relevant here)
| Folder |
FDI |
+/- |
| src/xcode/ENA/ENA/Source/Workers/Store |
19.31 |
637% |
src/xcode/ENA/ENA/Source/Scenes/ExposureSubmission/
__tests__ |
13.91 |
833% |
| src/xcode/ENA/ENA/Source/Services/Exposure Transaction |
13.66 |
570% |
| src/xcode/ENA/ENA/Source/Scenes/ContactDiary/AddAndEditEntry |
12.75 |
0% |
| src/xcode/ENA/ENA/Source/Services/Exposure Submission |
12.00 |
1000% |
| src/xcode/ENA/ENA/Source/Scenes/ContactDiary/Day |
11.07 |
0% |
| src/xcode/ENA/ENA/Source/Scenes/ExposureSubmission |
10.56 |
195% |
src/xcode/ENA/ENA/Source/Scenes/ExposureSubmission/
View |
10.34 |
583% |
| src/xcode/ENA/ENA/Source/Scenes/ContactDiary/EditEntries |
9.76 |
0% |
| src/xcode/ENA/ENA/Source/Services/__tests__/Mocks |
9.00 |
584% |
| src/xcode/ENA/ENA/Source/Developer Menu/Features |
7.71 |
0% |
| src/xcode/ENA/ENA/Source/Services/Exposure Transaction/__tests__ |
7.22 |
173% |
| src/xcode/ENA/ENA/Source/Services/Risk/Provider |
6.80 |
189% |
src/xcode/ENA/ENA/Source/Services/DownloadedPackagesStore/
__tests__ |
6.64 |
0% |
| src/xcode/ENA/ENA/Source/Services/Risk/Calculation |
6.50 |
735% |
| src/xcode/ENA/ENA/Source/Models/Exposure |
5.88 |
0% |
| src/xcode/ENA/ENA/Source/Scenes/Onboarding |
5.55 |
1374% |
| src/xcode/ENA/ENA/Source/Scenes/ENSetting/EUSettings |
5.11 |
7965% |
| src/xcode/ENA/ENA/Source/Scenes/ContactDiary/Info |
4.44 |
0% |
Table1: Feature-debt-index in Q4 2020
Values marked in yellow represent a signal level, while red numbers indicate that a critical value has been reached. The source code directories already mentioned in the take-aways are highlighted in the table. These are precisely those directories which are responsible for the broad feature-coupling of the feature-sets for infection risk assessment/calculation and the improved handling of test results from versions 1.7 and 1.9. In addition, it is evident that some of the associated test directories have also reached a signal or critical level.
It is also noticeable that some ContactDiary directories have also reached at least signal level. In the above section on the contact diary feature set of version 1.10 it was explained that this is due to the local coupling of these features with each other. This is reflected here again in the associated directories. This local coupling can be filtered when calculating the feature-debt-index. However, we have omitted to do so here for the sake of completeness and consistency of the statements.
Maintenance (Bug-Fixing) as Consequence
So what are the effects and symptoms of these high feature-debt values? One easily identifiable impact can be seen in the extent of maintenance effort in these source code directories. Table 2 lists the bug-fixing effort from Q4 of 2020 (sorted by extent in units of cLOC, i.e. changed lines of code, as described in [2]). Again, some of the mentioned Exposure Submission and Risk directories are most affected by maintenance effort.
| Folder |
Defect
Effort |
+/- % |
| src/xcode/ENA/ENA/Source/Scenes/ExposureSubmission/View |
3.96 K |
4.03 K |
src/xcode/ENA/ENA/Source/Scenes/ExposureSubmission/
__tests__ |
2.13 K |
21.16 K |
| src/xcode/ENA/ENA/Source/Services/Risk/Provider |
1.97 K |
528.00 |
| src/xcode/ENA/ENA/Source/Scenes/ExposureSubmission |
777.00 |
5.88 K |
| src/xcode/ENA/ENA/Source/Scenes/Onboarding |
657.00 |
2.89 K |
| src/xcode/ENA/ENA/Source/Services/__tests__ |
589.00 |
460.00 |
| src/xcode/ENA/ENA/Source/Services/Risk/KeyPackageDownload |
240.00 |
0 |
src/xcode/ENA/ENA/Source/Scenes/OptionGroup/
DatePickerOption |
232.00 |
0 |
| src/xcode/ENA/ENA/Source/Services/Risk/__tests__ |
219.00 |
812.00 |
| src/xcode/ENA/ENA/Source/Services/Exposure Transaction/__tests__ |
189.00 |
626.00 |
| src/xcode/ENA/ENA/Source/Services/Exposure Transaction |
176.00 |
58.00 |
| src/xcode/ENA/ENA/Source/Client/HTTP Client |
171.00 |
800.00 |
| src/xcode/ENA/ENA/Source/Scenes/ContactDiary/EditEntries |
161.00 |
0 |
| src/xcode/ENA/ENA/Source/Developer Menu/Features |
155.00 |
0 |
| src/xcode/ENA/ENA/Source/Models/Exposure |
155.00 |
63.00 |
| src/xcode/ENA/ENA/Source/Scenes/DynamicTableViewController |
152.00 |
3.70 K |
| src/xcode/ENA/ENA/Source/Models/Exposure/__tests__ |
147.00 |
568.00 |
| src/xcode/ENA/ENA/Source/Developer Menu/Features/DMDeviceTimeCheck |
123.00 |
0 |
| src/xcode/ENA/ENA/Source/Client/HTTP Client/__tests__ |
118.00 |
0 |
| src/xcode/ENA/ENA/Source/Services/Risk/Calculation |
118.00 |
55.00 |
Table 2: Defect-effort in Q4 2020
Plotting the feature-debt-index on the x-axis and the defect-effort as bubble size also helps to visualize the whole thing better in Figure.12. It’s evident that there is a correlation between the feature-debt-index and the defect-effort: the greater the feature-debt, the greater the bug-fixing effort (as bubble size).
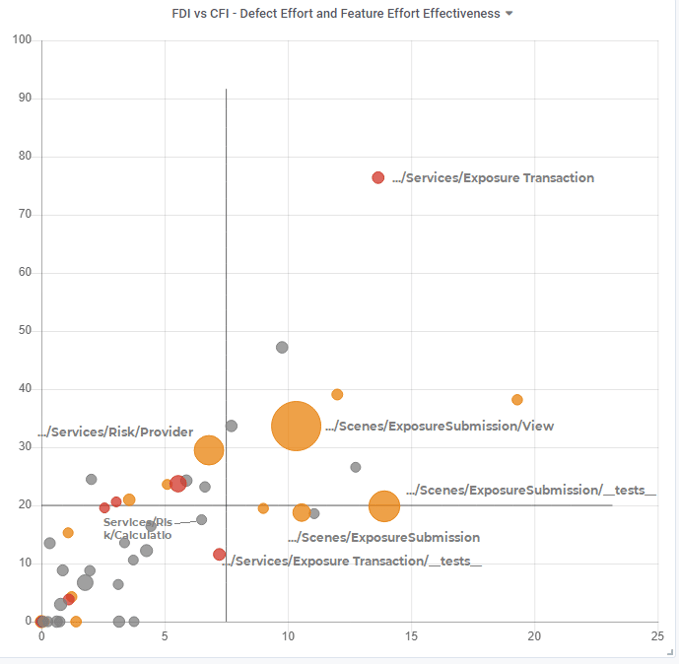 Figure 12: Defect-effort as bubble size versus feature-debt-index und CFI
Implementation of New Features Becomes More Expensive (Complex)
Ideally, you want to be able to measure whether adding new features becomes more difficult. Simply measuring the number of features per unit of time (e.g. quarter) results in misleading values, since the effort per feature varies greatly. In our experience, development effort per feature tends to follow the Pareto rule: about 80% of the effort is spent on about 20% of the features. In [4] and [11] we explain an approach to prorate refactoring effort when implementing new features. The ratio of effort to the proportion of new code created for the feature plays a role. The more the ratio moves from 1 towards 2 or higher, the higher the refactoring part. This is true for individual features but also for source code directories and files.
Table 3 lists these values for source code directories. We call the said ratio of effort to newly created code for features the feature-effort-effectiveness-index (FEE). Once again, it’s evident that with regard to this indicator, the same source code directories as for defect-effort have an FEE value greater than 1.5.
| Folder |
FEE |
New Code |
| src/xcode/ENA/ENA/Source/Scenes/ContactDiary/Store |
1.27 |
4.89 K |
| src/xcode/ENA/ENA/Source/Services/Risk/Provider |
1.68 |
3.50 K |
| src/xcode/ENA/ENA/Source/Services/Risk/Calculation |
1.25 |
3.39 K |
src/xcode/ENA/ENA/Source/Scenes/ExposureSubmission/
View |
1.51 |
3.31 K |
src/xcode/ENA/ENA/Source/Scenes/ExposureSubmission/
__tests__ |
1.78 |
2.07 K |
| src/xcode/ENA/ENA/Source/Scenes/ContactDiary/Day |
1.10 |
2.01 K |
| src/xcode/ENA/ENA/Source/Scenes/Home/Cells |
1.17 |
1.87 K |
| src/xcode/ENA/ENA/Source/Scenes/ExposureSubmission |
1.79 |
1.68 K |
| src/xcode/ENA/ENA/Source/Scenes/ContactDiary/AddAndEditEntry |
1.14 |
1.22 K |
| src/xcode/ENA/ENA/Source/Scenes/ContactDiary/EditEntries |
1.07 |
1.09 K |
Table 3: Feature-effort-effectiveness in Q4 2020
In this context, a visualization with the feature-debt-index plotted on the x-axis and the feature-effort-effectiveness as the color of the bubbles in Figure 12 is helpful, too. A red color means that the feature-effort-effectiveness of the respective directory has exceeded the critical value of 2.0, while an orange color indicates signal-level values between 1.5 and 2.0.
The identified problematic source code directories have the highest maintenance efforts AND show symptoms of already occurring poor extensibility with new features. The reasons are structural weaknesses of the architecture in these areas of the code as we measure them with the feature-debt-index.
Can this now be said with certainty?
On the one hand, we can rule out poor code quality. As mentioned earlier, the SonarQube tool is used for this purpose during the development and good code quality is ensured. A further look from a new angle in Table 4 brings additional clarity.
| Folder |
Defect
Impact |
+/- |
| src/xcode/ENA/ENA/Source/Services/Risk/Provider |
5.06 |
894% |
| src/xcode/ENA/ENA/Source/Scenes/ExposureSubmission |
2.58 |
0% |
| src/xcode/ENA/ENA/Source/Services/Risk/KeyPackageDownload |
1.64 |
0% |
| src/xcode/ENA/ENA/Source/Scenes/ExposureDetection |
1.12 |
267% |
| src/xcode/ENA/ENA/Source/Scenes/ExposureSubmission/View |
0.97 |
573% |
| src/xcode/ENA/ENA/Source/Services/Exposure Transaction/__tests__ |
0.95 |
0% |
| src/xcode/ENA/ENA/Source/Services/Exposure Transaction |
0.88 |
596% |
| src/xcode/ENA/ENA/Source/Client/HTTP Client |
0.80 |
25% |
| src/xcode/ENA/ENA/Source/Services/Exposure Submission |
0.75 |
0% |
Table 4: Defect-impact in Q4 2020
With the defect-impact, we capture the extent of so-called “cognitive bugs” that arise as a consequence of a bad feature-debt index. The special thing about it is that, on the one hand, fixing these bugs extends across several source code files. On the other hand, follow-up bugs often occur in code areas with high FDI, and are therefore highly coupled to the previous bugs. One attempt to fix such a bug is usually not sufficient, since one loses the understanding about the interrelated code locations due to the interwoven nature of the features in the code and often does not clean up all affected code locations at once as required. More details can be found under [12].
Decrease in Code Documentation at Critical Points
So far only the defect-impact for the Risk/Provider directory has reached the yellow signal level. It can therefore be concluded that there are other factors besides the FDI values that are responsible for the high defect-effort in the Exposure Submission directories. As already discussed, it cannot be due to the code quality. Therefore, we analyzed the status of source code documentation and its trends in the Exposure Submission and Risk directories. We consider a ratio of comments to program code without blank lines (our term for it is source-code-documentation (SCD) ratio) below 10% to be a critical level and within 10% to 20% to be a signal level.
| Folders |
SCD |
No. of Defects |
Defect
Effort |
src/xcode/ENA/ENA/Source/Scenes/ExposureSubmission/
View |
0.09 |
30 |
4.27 K |
| src/xcode/ENA/ENA/Source/Scenes/ExposureSubmission |
0.10 |
42 |
7.61 K |
src/xcode/ENA/ENA/Source/Scenes/ExposureSubmission
__tests__ |
0.11 |
22 |
2.45 K |
| src/xcode/ENA/ENA/Source/Views/ExposureSubmission |
0.14 |
3 |
64.00 |
| src/xcode/ENA/ENA/Source/Services/Exposure Submission |
0.16 |
7 |
98.00 |
src/xcode/ENA/ENA/Source/Services
Exposure Submission/__test__ |
0.16 |
0 |
0 |
Table 5: SCD-ratio and defect-effort for Exposure Submission in Q4 and Jan 2021
When observing the trends, it is also evident that the SCD-ratio values in the source code files of the Exposure Submission directories have dropped sharply in the last few months up to January 2021.
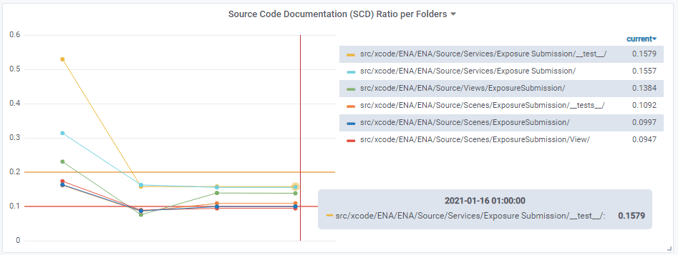 Figure 14: Trends of the SCD-ratio values for Exposure Submission
In the Risk directories, there are similar, albeit less pronounced, trends and drops from Dec 2020 to Jan 2021. The SCD ratio in the relevant Risk/Provider directory (unlike the Risk/Calculation directory) is still 17% – quite close to the non-critical 20%.
| Folder |
SCD |
No. of Defects |
Defect
Effort |
| src/xcode/ENA/ENA/Source/Services/Risk |
0.11 |
30.00 |
2.76 K |
| src/xcode/ENA/ENA/Source/Services/Risk/Provider |
0.17 |
24.00 |
2.18 K |
src/xcode/ENA/ENA/Source/Services/Risk/
KeyPackageDownload |
0.03 |
5.00 |
240.00 |
| src/xcode/ENA/ENA/Source/Services/Risk/__tests__ |
0.02 |
3.00 |
219.00 |
| src/xcode/ENA/ENA/Source/Services/Risk/Calculation |
0.08 |
3.00 |
118.00 |
Table 6: SCD-ratio and defect-effort for Risk in Q4 2020 and Jan 2021
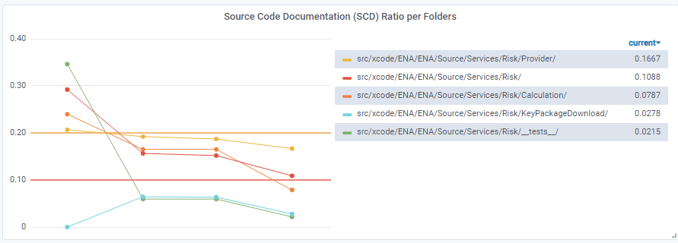 Figure 15: Trends of the SCD-ratio values for Risk
Summary

Using DETANGLE, we also estimate the improvement effort to refactor these critical code areas. We consider this effort as the amount of technical debt to be repaid in the future. The details of the calculation are less interesting here. It is worth mentioning that according to DETANGLE, the estimate of this effort measured against the total effort of the last quarter Q4/2020 would correspond to a feasible effort of about one man-week. We are happy to be measured on whether this statement would correspond to the real effort spent for the refactoring. We strongly recommend to express refactoring work as a separate issue type and associating refactoring commits with these tickets as described in [13].
Feature-Network-Diagrams
Finally, we would like to draw attention to another visualization which expresses the effect of feature-coupling very vividly. By a feature-network-diagram we mean a network of nodes and edges that links issues to source code files.
On the one hand, the round nodes in Figure 17 represent feature, enhancement, and bug issues/PRs in GitHub. On the other hand, the rectangular nodes are source code files. There is an edge between a feature, enhancement or bug and a file just when the source code file has been modified to implement the issue/PR.
Figure 17 and Figure 18 represent two different perspectives with regard to feature-coupling. Figure 17 shows source code files with high feature-coupling values above a certain (quite low) threshold, while Figure 18 lists source code files that have very low or no feature-coupling.
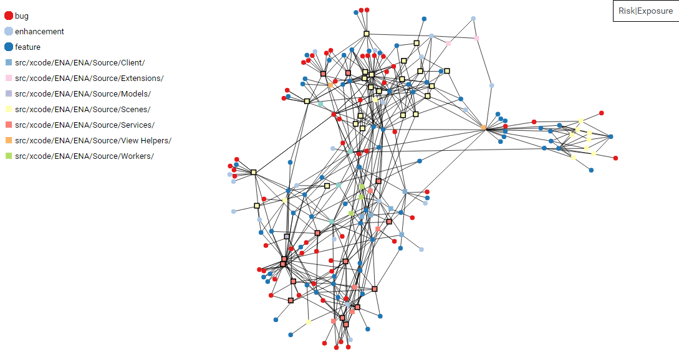 Figure 17: Feature-network with source code files having a high feature-coupling; period July 2020 until January 2021
The red circles represent bug Issues/PRs. Source code files from the Risk and Submission directories are outlined in black. You can quickly see with the naked eye that these files with high feature coupling are very often increasingly affected by bugs.
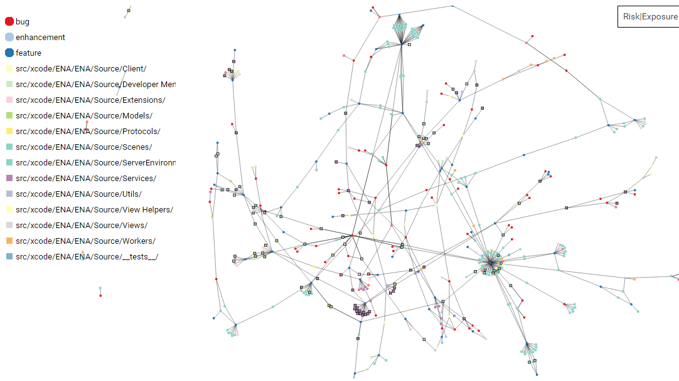 Figure 18: Feature-network with source files having low feature-coupling; period July 2020 until January 2021
Figure 18 offers a contrasting picture: Source code files with no or low-threshold feature-coupling are by and large only affected by bugs very rarely, let alone many bugs.
These two figures vividly illustrate the consequences of high feature-coupling. If there is no refactoring to eliminate the architectural weaknesses of the feature-coupling, these source code files represent a kind of attractors for maintenance expenses and are potentially responsible for their uncontrolled growth.
Links
[1] JCON 2020 Talk “Feature and Time-Based Software Analysis”,
How it works: https://youtu.be/aD4OQScGILo?t=510
2 minutes : 8:30 – 10:32
[2] JCON 2020, “Feature and Time-Based Software Analysis”,
Measuring Development Effort: https://youtu.be/aD4OQScGILo?t=790
5 minutes : 13:10 – 18:27
[3] JCON 2020, “Feature and Time-Based Software Analysis”,
Calculating Feature Debt: https://youtu.be/aD4OQScGILo?t=1073
10.5 minutes: 17:53 – 28:30
[4] Blog Cape of Good Code, “Architecture Hotspots – Despite Good Dependency Structures”
https://capeofgoodcode.com/en/knowledge/architecture-hotspots-despite-good-dependency-structures/
[5] Github Pull Requests:
https://docs.github.com/en/github/collaborating-with-issues-and-pull-requests/about-pull-requests
[6] Release description 1.12 Corona Warn App:
https://www.coronawarn.app/de/blog/2021-02-04-cwa-1-12-announcement/
[7] Release description 1.11 Corona Warn App:
https://www.coronawarn.app/de/blog/2021-01-28-corona-warn-app-version-1-11/
[8] Release description 1.10 Corona Warn App:
https://www.coronawarn.app/de/blog/2020-12-28-corona-warn-app-version-1-10/
[9] Release description 1.9 Corona Warn App:
https://www.coronawarn.app/de/blog/2020-12-16-corona-warn-app-version-1-9/
[10] Release description 1.7 Corona Warn App:
https://www.coronawarn.app/de/blog/2020-11-25-corona-warn-app-version-1-7/
[11] JCON 2020, “Feature and Time-Based Software Analysis”,
Measure refactoring proportions in feature implementations:
https://youtu.be/aD4OQScGILo?t=871
3 minutes : 14:34 – 17:50
[12] JCON 2020, “Feature and Time-Based Software Analysis”,
Cognitive Bugs: https://youtu.be/aD4OQScGILo?t=1658
2 minutes: 27:38 – 28:22
[13] Blog Cape of Good Code, “Improving Software Quality by Choosing Reasonable Issue Types”,
https://capeofgoodcode.com/en/knowledge/reasonable-issue-types/
Appendix – Details on the Approach
Our approach to determine features and bugs (and the changes in the code resulting from them) was to derive their type from labels and keywords of Github PRs and issues. In doing so, we tried to derive not only the types “feature”, “enhancement” and “bug”, but also the types such as “chore”, “refactor” and “technical” according to the following rules for Github PRs and issues (restricting ourselves here on the blog to “feature”, “bug” and “enhancement”). We can also only touch on the handling of referencing issues in commits here. To put it simply, we have applied the following rules:
- Specify PR/issue type per PR/issue label, if a label was available. In the case of several types, we have defined the following priority rule:
- bug
- feature
- enhancement
- chore
- Determine PR/issue type via keywords in the title bestimmen. If a label was not available:
- Keyword “feature” in the title: PR/issue becomes feature
- Keyword “bug” in the title: PR/issue becomes bug
- Keyword “fix” but without “typo” in the title: PR/issue becomes bug
- Resolve references to PRs/issues in commits:
- If a PR is referenced in the commit, the PRs/issues further referenced in the PR title and their type (over the entire transitive hull of references) are determined for this PR.
- For each commit, the PR to which the commit is assigned according to Github is taken into account.
- Then all PRs/issues that have a type are selected. All other PRs/issues are dropped.
- Referenced PRs/issues without a type are retained if there are no PRs/issues with a type specification.
In order to get a better impression, some figures are mentioned for the period from the beginning, i.e. May 30th, 2020 to January 28th, 2021:
| Characteristic GitHub PR |
Quantity |
| Github PRs ohne Label |
681 |
| Github PRs mit Label “bug” |
279 |
| Github PRs mit Label “feature” |
99 |
| Github PRs mit Label “enhancement” |
86 |
| Github PRs mit Keyword “bug” im PR Titel |
114 |
| Github PRs mit Keyword “fix” aber nicht “typo” im PR Titel |
156 |
| Github PRs mit Keyword “feature” im PR Titel |
181 |
For example, we were able to determine a type for 451 PRs (114 + 156 + 181) based on the keywords in the title of the 681 PRs without a label.