As a project manager for a software development team
- Do you know the team structure?
- Do you know who is working on what?
- Do you know whether the respective developer has the best knowledge prerequisites?
“You don’t have to”, say the advocates of agile development, because “the team organises itself”. And by the way, the principle of “collective code ownership” prevails, i.e. everyone is responsible for everything in the code [1].
With a little thought, one starts to wonder, e.g. because “collective code ownership” contradicts the principle of modularisation and efficient development [2].
But the principle is not only dubious, it also causes harm. Among other things, the “diffusion of responsibility” [7] phenomenon occurs, in which no one really feels responsible any more. Individual developers lose sight of the bigger picture because many of their fellow developers have also changed the same code.
In the process, the different development styles mix into a cacophony of code, and the cognitive effort required to understand the code increases to the point of incomprehensibility.
How true it is that many cooks can spoil the broth. An erosion of the quality of the work product becomes inevitable and ultimately recognisable by the fact that escalating bug-fixing efforts occur.
Now it is obvious to ask about the alternatives to “collective code ownership”.
- What are good distributions of responsibility and knowledge in an (agile) team instead?
- How can you recognise early enough that a team is not (any longer) working together effectively?
- What other alarm signals are there for problematic projects and what are the answers to them?
 In this article, we will not make purely theoretical observations, but analyse the German Corona-Warn-App as a current and relevant example. We examined the knowledge structures of the two iOS and Android development teams step by step to identify good and risky patterns such as Knowledge Balances, Knowledge Islands and Knowledge Tangles. Experience shows that the conclusions and recommendations from such an analysis can be used by self-organised software teams as well as by project managers for more effective team cooperation and leadership.
Please find more insights about the architecture quality and technical debt of the Corona-Warn-App in our blog: Corona-Warn-App – On the Way To Critical Technical Debt?
1. Risks Due To the Exchange of Development Teams
The two apps (iOS and Android) are developed by two different development teams, which seems to make sense given the different technologies such as programming languages and libraries used. Surprisingly, the evaluation of our analysis data points to a replacement of the entire development team during 2020. This is true for both the iOS app and the Android app. We come to this conclusion from the temporal development of two pieces of information:
- Number of commits per developer over time (Fig. 1) and
- Comparison of anonymised developer lists over time.
Figure 1 shows the number of commits to the GitHub code repository from quarter 2 to quarter 4 of 2020 for the iOS app development.
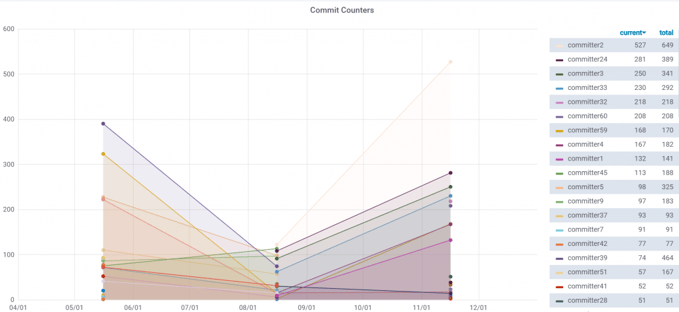 Figure 1: Time series of commits per developer in Q2-Q4/2020 of the iOS app development
In Fig. 1, three key points can be identified on the X-axis:
- on the left, the commits in the 2nd quarter of 2020 (Q2)
- on the right, the commits in the 4th quarter of 2020 (Q4) and
- in the middle, the commits between the quarters (3rd quarter 2020 (Q3)).
It is immediately apparent that the number of commits was lowest in Q3, which can be explained by the summer holiday period and can thus be classified as normal. What is really striking, however, is that the members of the teams in Q2 are completely different from those in Q4, which can be seen from the different colours (each colour is assigned to a specific developer). The authors have no knowledge about the reasons for the exchange.
There might be single developers who were consistently part of the development from Q2 to Q4, but the key players with the most commits are not the same before and after the summer period. It would be little surprise if the loss of existing project knowledge was initially accompanied by a significant setback in project efficiency.
In the following, we focus our analyses and statements on the development status of the Corona-Warn-pp, which was available in Q4 2020, unless otherwise described.
2. Striking Knowledge Islands in the Teams
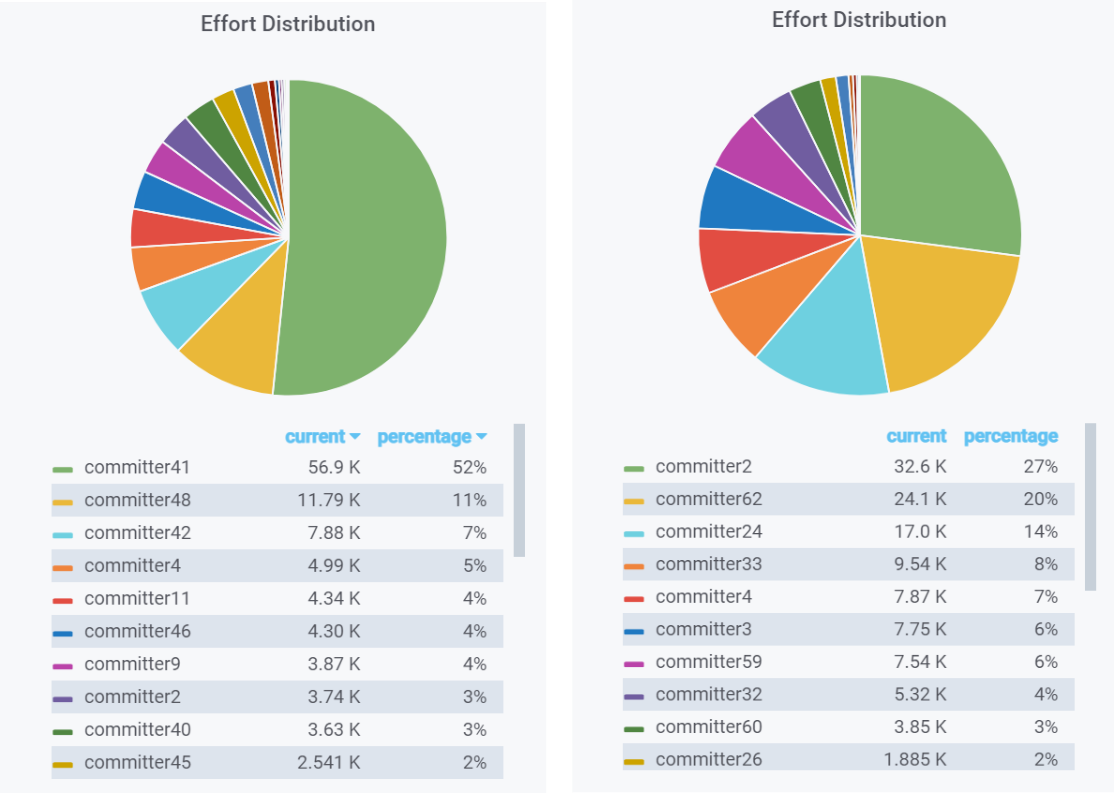
Furthermore, the distribution of development efforts per developer for both apps was considered (for an explanation of the measurement of development effort, please refer to [4]).
Looking at Figure 2 (left sub-picture), it is noticeable that over half of the Android development effort is accounted for by one developer (a total of 28 developers are involved). This indicates a highly pronounced knowledge/skills island consisting of a single developer (committer41). This is very critical not only for a product like the Corona-Warn-App, with its enormous socio-economic relevance. A failure of this developer could have problematic consequences. It is to be hoped that this “star” developer is not also an external employee.
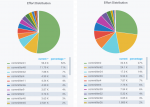
Figure 2: Comparison of development efforts between Android (left) and iOS developers (right) in Q4/2020
The findings for iOS development (Fig. 2, right sub-picture) are somewhat better, but the effort is not very evenly distributed either. Only 3 out of 21 developers account for more than 61% of the development effort. Committer62 also plays an independent role as a tester. Ideally, the efforts of test development should be distributed among many developers. Taking this aspect into account, a development effort of more than 50% can only be allocated to two developers (committer2 and committer24).
The authors recommend regularly measuring the analysis of the development effort of individuals (this does not result from the billed hours!) in order to recognise the risk of dependencies on single developers in time and to be able to take countermeasures.
3. Questions on the Effectiveness of Knowledge Distribution
There will have been reasons or constraints to carry out such an extensive exchange in the project teams. We cannot judge from a distance whether the hoped-for results have been achieved. The teams and project leaders should ask themselves the following questions:
- Is the current unbalanced distribution of effort uncritical or should it be counteracted in a timely manner?
- Is the development knowledge nevertheless distributed in such a way that there is no major risk for the project?
- Do the developers work together so well after the exchange that the team also develops effectively and adds value?
- What patterns of knowledge distribution and what effects are discernible?
4. Assessment Criteria for the Team and Knowledge Structure
The fundamental challenge in any development project is to ensure an effective and robust team and knowledge structure. After several studies [5], we have found that teams of two intuitively develop a good kind of knowledge sharing and knowledge structure. We refer to this pattern, when exactly two developers work on a not-too-small shared set of source files, as Knowledge Balance. Such an ideal distribution of knowledge and skills does not always necessarily arise in reality, nor is it always sought. We therefore recommend analysing this aspect in good time for larger and urgent projects. From our analyses and experiences, we have compiled some patterns (knowledge patterns) of knowledge distribution in Table 1:
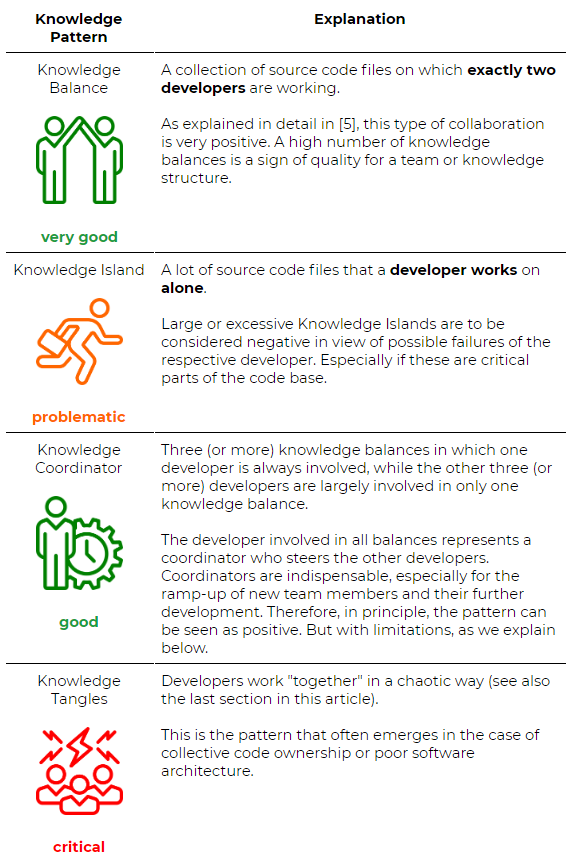
Table 1: Knowledge Patterns and Explanations
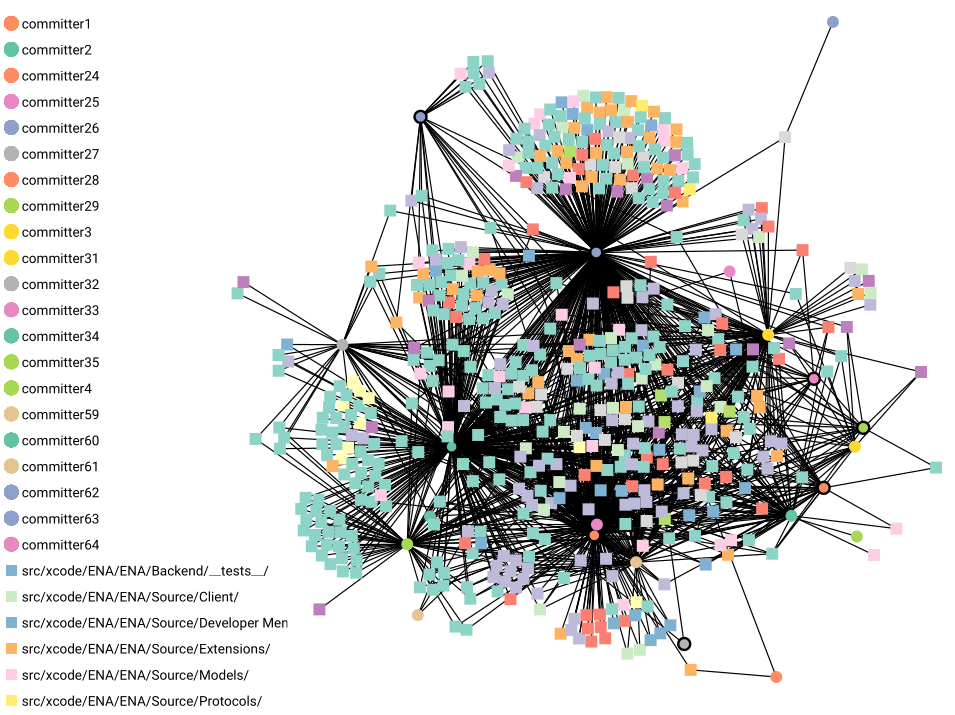
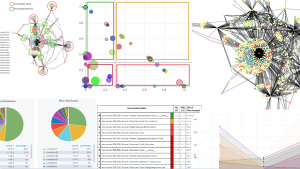
To visually identify these patterns of knowledge distribution, we use network diagrams from the DETANGLE analysis data. The diagrams allow first qualitative indications of possible challenges regarding a too inhomogeneous knowledge distribution. Fig. 3 shows an example for the iOS Corona-Warn-App in Q4/2020.
 Figure 3: Network diagram showing the relationship between source code files and developers (committers) for iOS and Q4/2020
Source code files are shown as rectangles, developers (committers) are shown as circles. An edge between a developer and a source code file means that the developer has worked on the file and made changes during the period in question.
In view of more than 20 developers, the diagrams are quite confusing without further filters. Nevertheless, the aforementioned large Knowledge Island (committer62, top centre) stands out easily. Furthermore, figures 3 and 4 confirm the values of the effort distribution already mentioned, namely that committer2, committer62 and committer 24 account for more than 61% of the development effort in iOS app development.
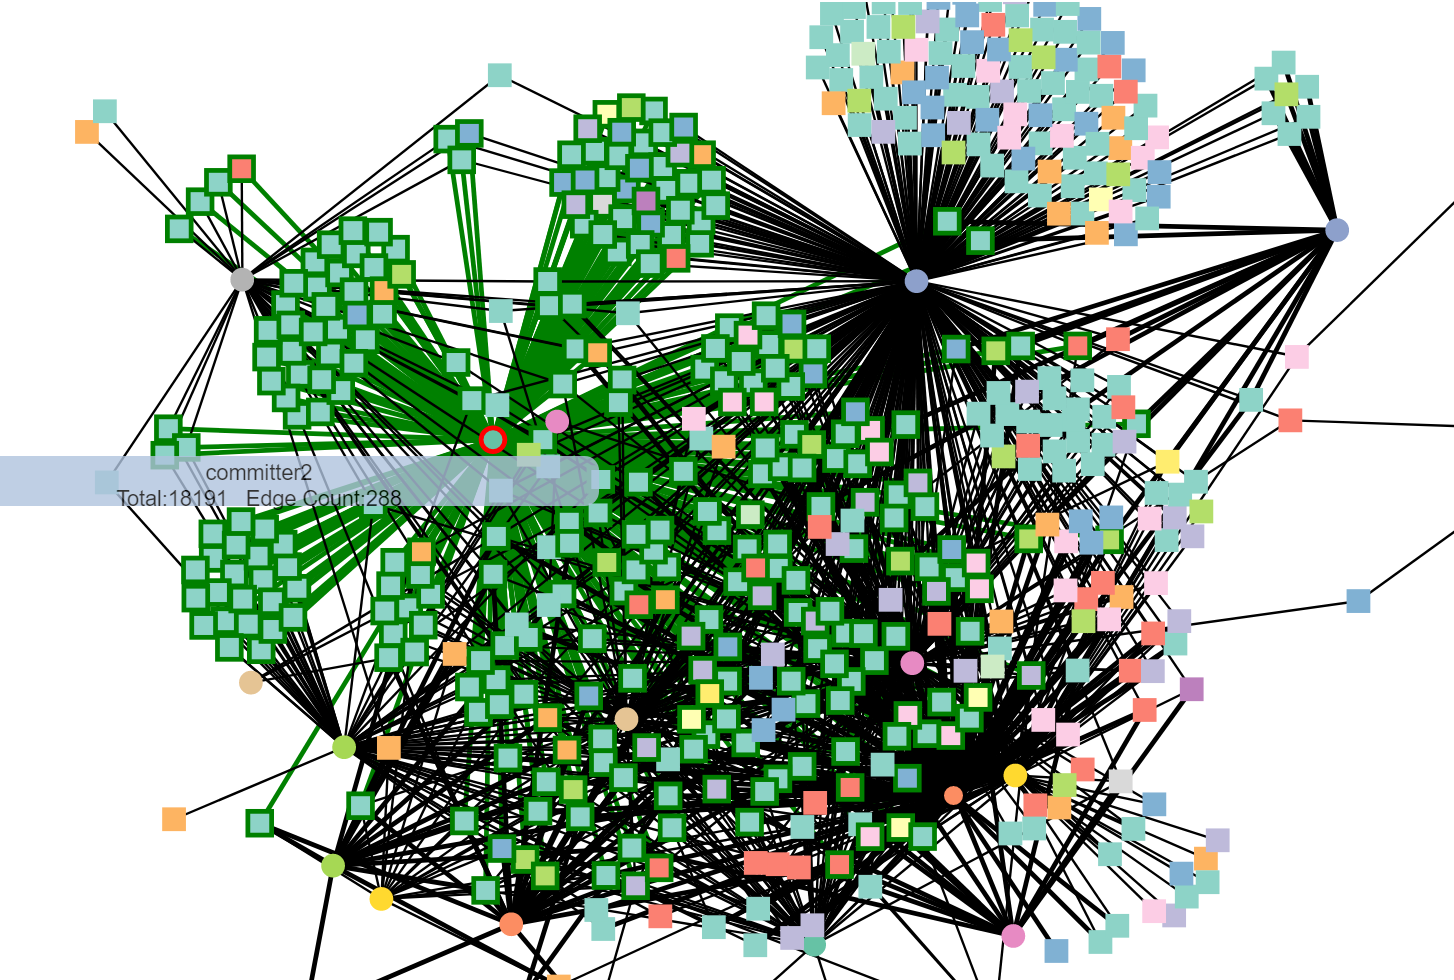
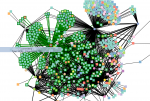 Figure 4: Files outlined in green were processed by committer2 in Q4/2020
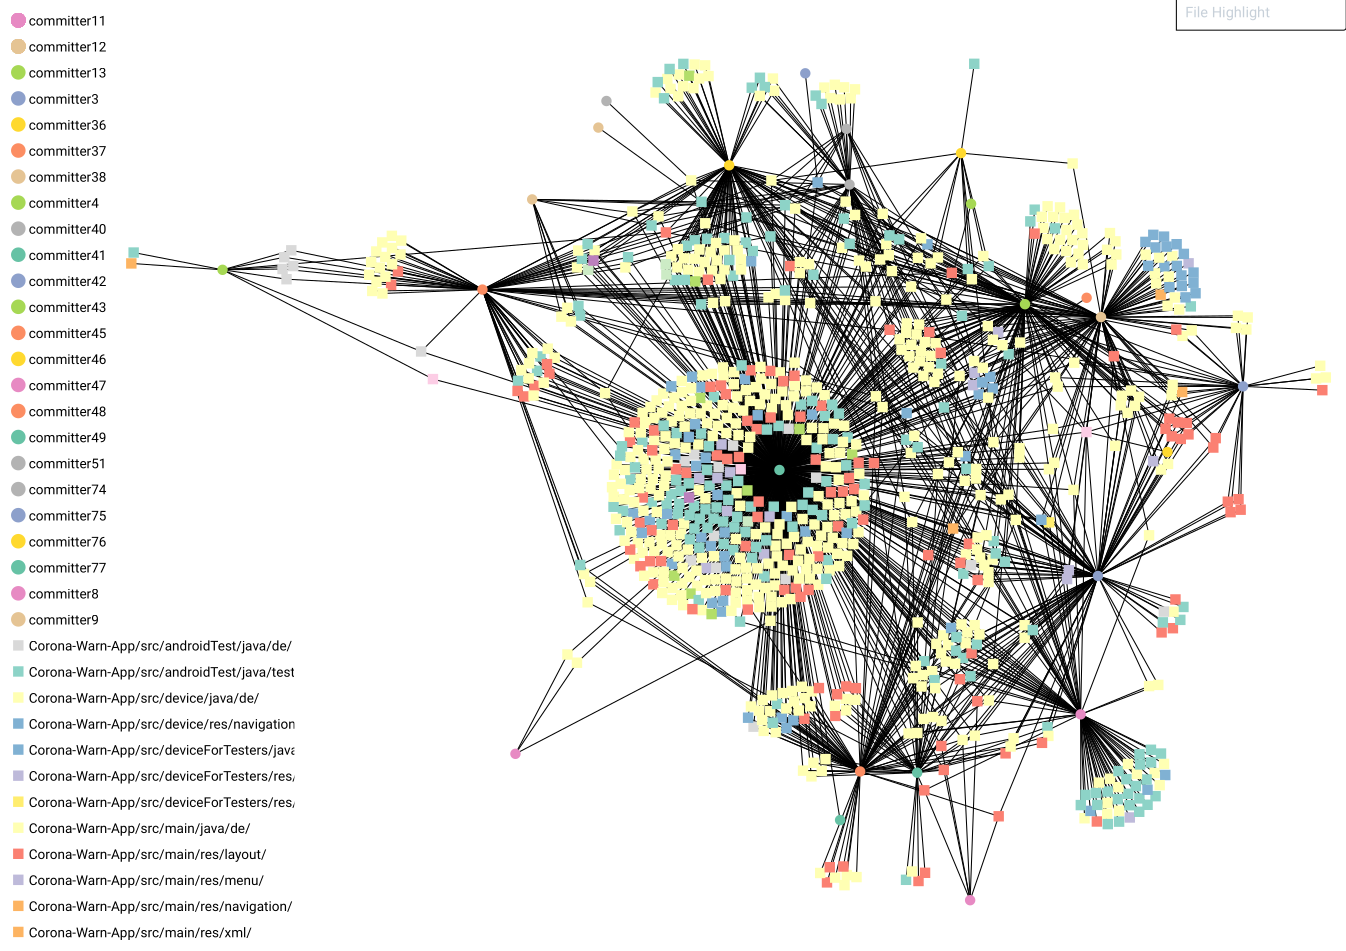
Fig. 5 shows the network diagram for the Android variant of the Corona-Warn-App. Here, too, knowledge concentrations can be easily identified as clusters in the middle and at the edge. The visual impression of Knowledge Islands is confirmed by the values on the inhomogeneous effort distribution (Fig. 2). These effort and knowledge distribution analyses should be part of the project KPIs in the field of software engineering. They make it possible to identify the causes of project risks at an early stage and to take appropriate countermeasures.
 Figure 5: Network diagram showing the connection between source code files and developers (committers) for Android and Q4/2020
5. Assessing the Effectiveness of Knowledge Sharing
However, in order to take appropriate countermeasures, the effectiveness of the knowledge structure at hand must be assessed in detail. To do this, we will apply certain views or filters to these network diagrams:
- Issue type (e.g. by bugs or features/enhancements): source code files, developers and edges are only displayed if the files have only been worked on in the context of an issue of the selected issue type.
- Knowledge Patterns: filtering by certain patterns such as Knowledge Islands and Knowledge Balances.
Knowledge sharing is effective when:
- Developers should be enabled to ramp up or expand their knowledge. They should be able to gain a level of knowledge beyond initial bug-fixing that enables them to contribute to the implementation of new features to a high degree. Ultimately, as many developers as possible should have a global system knowledge to be able to carry out improvements (e.g. refactorings) in the code or major architectural changes independently.
- At the same time, the necessary coordination effort and the communication paths between developers should remain limited.
- And the development work can still be distributed and run in parallel as far as possible.
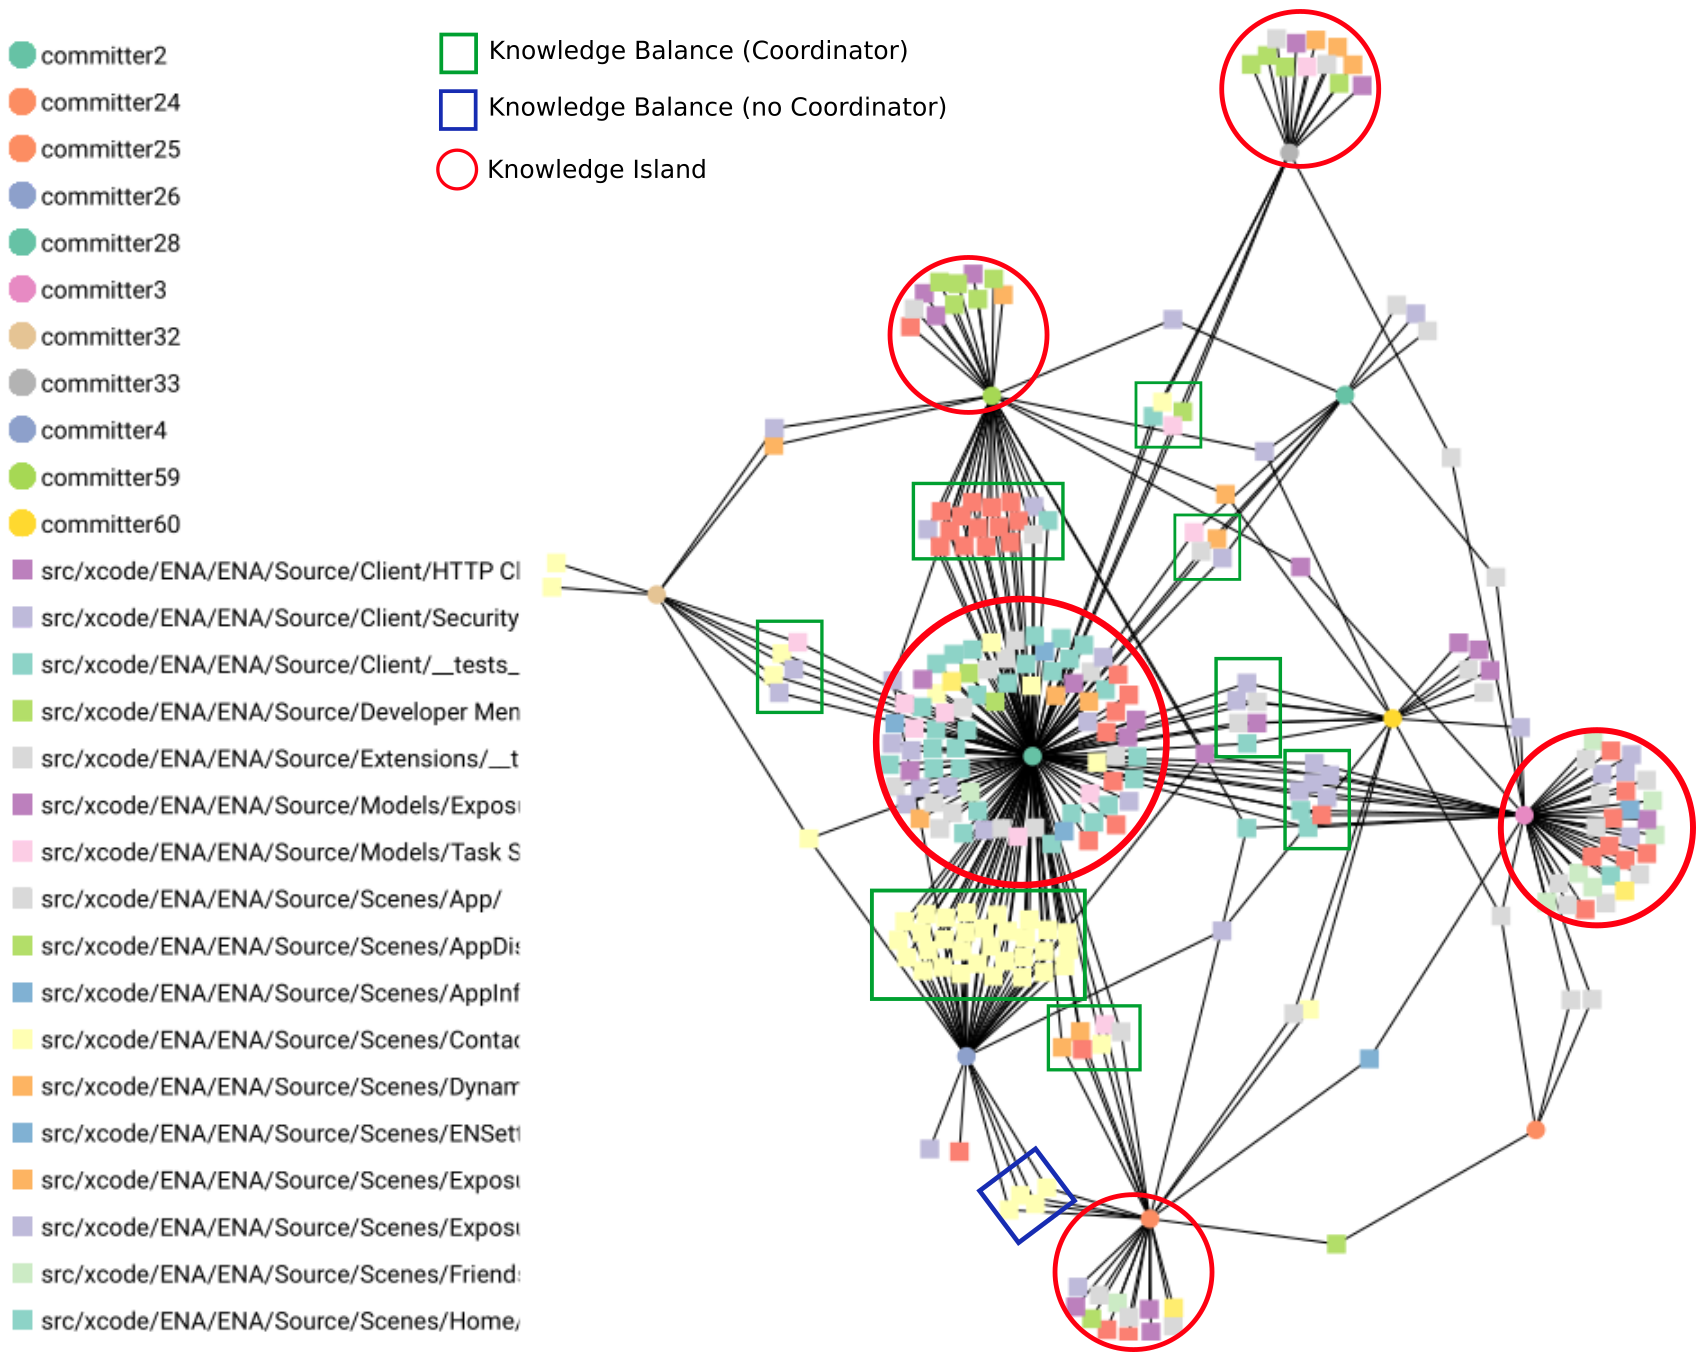
At the end of the period under review (Q4/2020), the majority of developers (15 out of 21 for the iOS app and 15 out of 28 developers for the Android app respectively) were involved in bug fixing. But a relevant perspective is formed by the meaningful views on feature development. In Figure 6 (for iOS), Knowledge Islands and Knowledge Balances are very visible.
The following insights for the iOS app and its feature development result from the analysis data:
- Only 11 (out of 21) developers add value by developing features or enhancements.
- One of the main developers already mentioned (committer2) forms a large Knowledge Island (circled in red in the middle).
- There are four other smaller Knowledge Islands (circled in red).
- All developers work more or less intensively with the main developer and form small or larger Knowledge Balances with him (marked with a green rectangle).
- The main developer (committer2) takes on the role of coordinator in feature development.
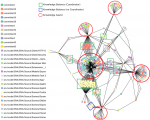 Figure 6: Source code files and developers of the feature and enhancement development (for iOS)
Therefore, it could be qualitatively concluded that nine of these eleven developers are each involved in feature development together. Those four who are islands of knowledge themselves already have more system knowledge, so they can work independently on a larger set of source files. Other developers mainly work with the coordinator on feature development.
One could therefore draw the positive conclusion that various developers in the project team are either being built up and/or already have advanced system knowledge. It would even be possible that even the independent knowledge in the Knowledge Islands of the coordinator and the said four other developers is balanced out by the shared knowledge in the Knowledge Balances.
The DETANGLE analysis of the Android app comes to very similar results as for the iOS app and is therefore not explained further here.
6. Key Figures for Evaluating the Effectiveness in Knowledge Distribution
For further analysis, the more qualitative visual impressions of the network diagrams are supplemented by quantitative evaluations of the data. Two indices corresponding to the respective patterns, the Knowledge Island LOC Index and the Knowledge Balance LOC Index, are measured for this purpose.
Knowledge-Island-LOC Index (KIL)
This is the percentage of Lines of Code (LOC) of source code files on which exactly one developer has worked compared to the LOC of all source code files on which development has generally taken place in a given period. The number is measured per total system or per directory.
Knowledge-Balance-LOC Index (KBL)
This is the percentage of the LOC of the source code files on which exactly two developers have worked, compared to the LOC of all source code files on which development has generally taken place in a given period. Different pairs of developers may have worked on different source code files from the same directory.
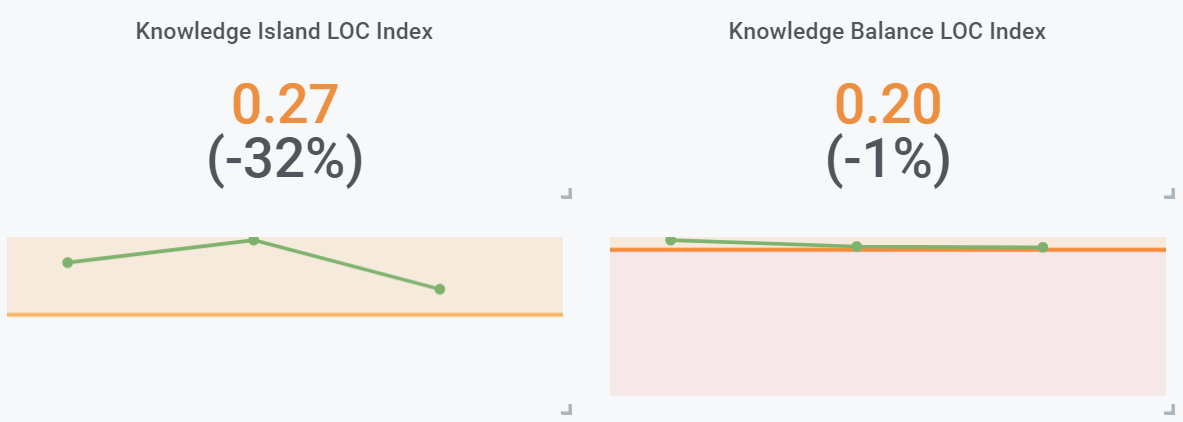
The two Knowledge Island LOC (KIL) and Knowledge Balance LOC (KBL) index values together result in a value below 1.0 (i.e. below 100%). The delta to 1.0 (100%) gives the LOC share of files in a directory in which at least three developers were actively involved. The KIL and KBL values for the entire iOS app are now shown in Figure 7.
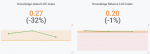
Figure 7: Change in the KIL and KBL values of the iOS app from Q2 to Q4 / 2020
The above conclusions can be confirmed quantitatively:
- The Knowledge Island LOC Index is 27% (approx. ¼) in Q4 / 2020 for the entire iOS app. The KIL value even fell by 32% in Q4 (compared to Q3 / 2020), which initially reflects a good trend and shows that the islands of knowledge behind the main developer are decreasing.
- In contrast, the Knowledge Balance LOC Index of the iOS app remained just above or equal to the critical threshold of 20% (approx. ⅕) throughout 2020 even after the team change. This means that the cooperation visible in the network diagrams as a team of two is still far from sufficient to achieve at least an average value of 30% or a good value of 40% of the code base of Knowledge Balances for good knowledge sharing.
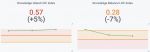
Figure 8: Change in the KIL and KBL values of the Android app from Q2 to Q4 / 2020
In comparison, we now consider the values for the Android app in Figure 8:
- Here, the Knowledge Balance LOC Index even fell after the team change. However, this is still at a value of 28%, i.e. close to an average value of 30%. This means that working in teams of two is a little more advanced on Android than on iOS. This is already indicated by the direct comparison of the network diagrams of the iOS and Android feature development.
- The better picture regarding Knowledge Balances is canceled out by a constantly critical Knowledge Island LOC Index of the Android app. This amounts to a very high 57% in Q4 / 2020 and implies that the coordinator continues to represent an oversized Knowledge Island in Android feature development.
7. Recommendations to Improve Effectiveness of Development
Even with limited access to the SAP JIRA project and the lack of opportunity to talk to the developers, the following recommendations are made to improve the effectiveness of the development of new features in the Corona Warning app:
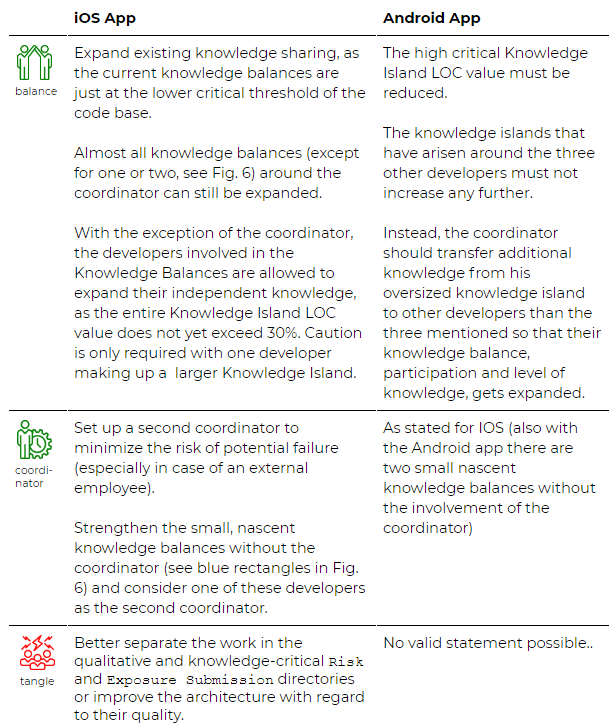
Table 2: Recommendations for improving the knowledge and effort distribution in the iOS and Android versions of the Corona-Warn-App
8. Collective Code Ownership Considered Harmful
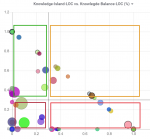
Figure 9: Source code directories and their KIL and KBL values (iOS in Q4/2020)
The KIL and KBL index values related to feature development can also be broken down into source code directories as shown in Figure 9 for Q4/2020. The KIL values are plotted on the horizontal axis and the KBL values for source code directories are plotted on the vertical axis. Each circle represents a source code directory, the area of the circle reflecting the LOC of all changed source code files in the directory. In other words, the larger the circle, the more LOC are the source code files that were changed in the directory in the period under consideration for feature development.
The diagram is divided into the following four squares, each with a different frame color:
Green: Directories with a low Knowledge Island value (less than 30%) and a medium to high proportion (at least 30%) of Knowledge Balance files. So it is a very good knowledge structure.
Yellow: Directories with a Knowledge Island value of medium to high (over 30%), but which are offset by a medium to high proportion (at least 30%) of Knowledge Balances. These directories still have a good knowledge structure.
Red (right quadrant): Directories whose high Knowledge Island value is not offset by Knowledge Balances. Here we are dealing with critical Knowledge Islands.
Dark red (left quadrant): Directories on which at least three developers have worked that cannot be attributed to either critical Knowledge Islands or good Knowledge Balances. These directories require a further critical review of how many developers have actually worked on them, and whether it is a rather “orderly” or “chaotic” way of working for developers on common source code files.
The reasons for viewing these directories as dark red, i.e. as very critical, are discussed below considering the principle of “Collective Code Ownership”.
This categorization can be understood using extreme examples. One of them are the “green” directories on the top left (KIL value of 0, KBL value of 1). These circles represent directories in which only two people were involved in development. In contrast, the circles at the bottom right of the diagram (KIL value of 1, KBL value of 0) represent “red”, critical Knowledge Island directories with a single developer.
Now let’s look at the selection of directories that we have already identified in our blog under [6] with regard to architecture quality, documentation and technical debts as in need of improvement. These are the Risk and Exposure Submission directories of the iOS app source code, which cover features for risk assessment and handling of Covid test results. These directories show a global coupling of these features and should also be viewed from the point of view of knowledge distribution.
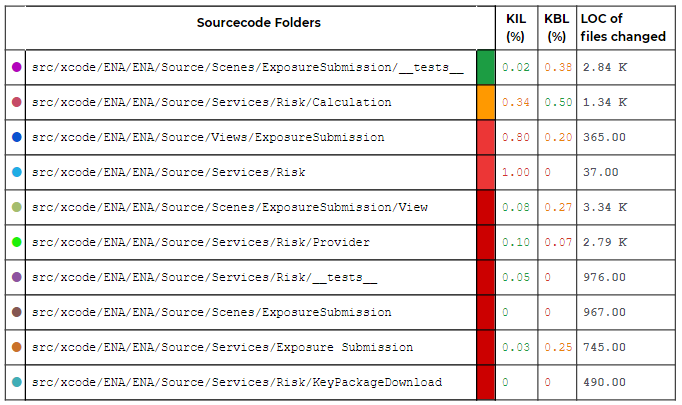 Table 3: KIL and KBL values of the Risk and Exposure Submission directories and LOC of the changed source code files in Q4/2020
The consideration of their knowledge index values allows several conclusions to be drawn:
- The directory
⬤ src/xcode/ENA/ENA/Source/Scenes/ExposureSubmission/__tests__ from the green quadrant represents a very good knowledge structure with a good Knowledge Balance and low Knowledge Island shares.
- In the directory
⬤ src/xcode/ENA/ENA/Source/Services/Risk/Calculation from the yellow quadrant, the property as a Knowledge Island is offset by a high Knowledge Balance LOC value.
- The vast majority of these directories are in the dark red quadrant from Fig. 9. These are neither Knowledge Islands nor Knowledge Balances. This means that more than three developers were involved in the majority of the files being edited.
For these directories it can be measured whether several to many developers have worked “together” in a chaotic manner. From our project experience we know why such source code directories “magically” attract maintenance effort. These are source code files that many developers have had to make more or less changes to over and over again. Ultimately, the “Diffusion of Responsibility” phenomenon [7] occurs that at some point no one feels really responsible for it any more. So developers sometimes lose perspective because many of the co-developers have also changed the code.
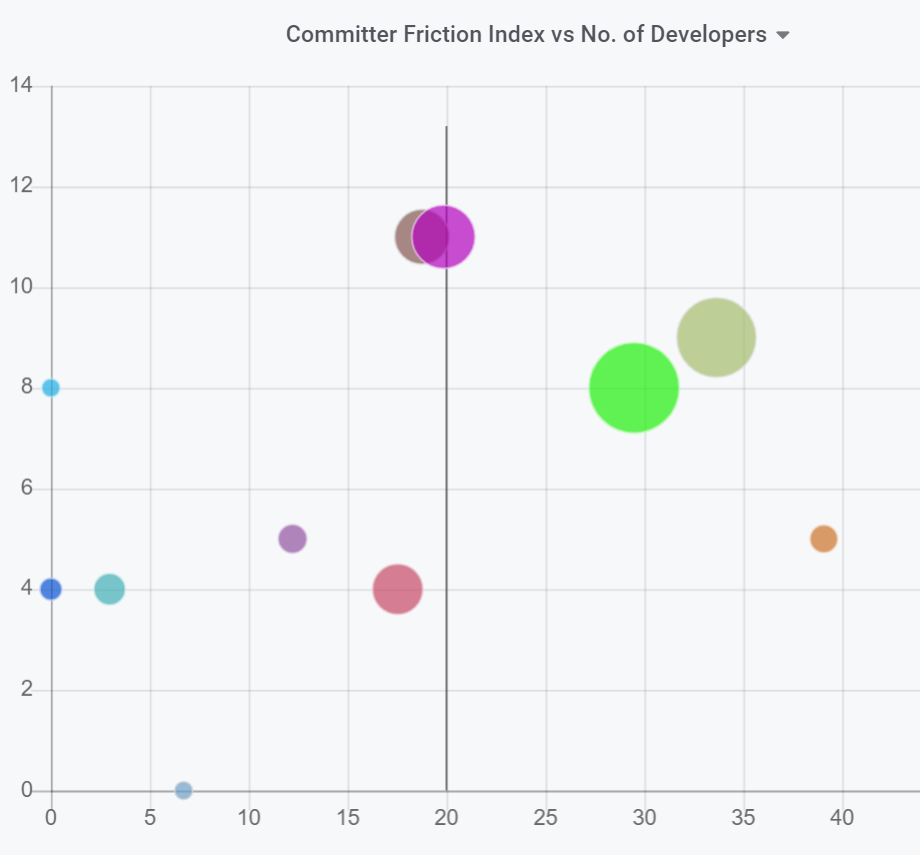
The Committer Friction Index (CFI) can also be measured using the DETANGLE analysis methods. We have plotted the diagram with the committer friction values and the number of developers for Q4/2020 in Figure 10:

Figure 10: CFI values of the Risk and Exposure Submission directories; x-axis: CFI, y-axis: number of developers
Looking at the values in Fig. 10 allows the following observations:
- The highest number of developers have worked on directory
⬤ src/xcode/ENA/ENA/Source/Scenes/ExposureSubmission/__tests__.
Although it has a high Knowledge Balance Index, its Committer Friction index is still in the medium range. This means that a directory with a large number of developers can simultaneously have a high proportion of source code files as part of Knowledge Balances and, on the other hand, several source files that have been edited in an unstructured manner by many developers.
- The following directories mentioned so far have high Committer Friction index values:
- ⬤ src/xcode/ENA/ENA/Source/Services/Risk/Provider
- ⬤ src/xcode/ENA/ENA/Source/Scenes/ExposureSubmission/View
- ⬤ src/xcode/ENA/ENA/Source/Services/ExposureSubmission
The effect on these directories with a high Committer Friction index is that they become maintenance hotspots with high bug-fixing efforts.
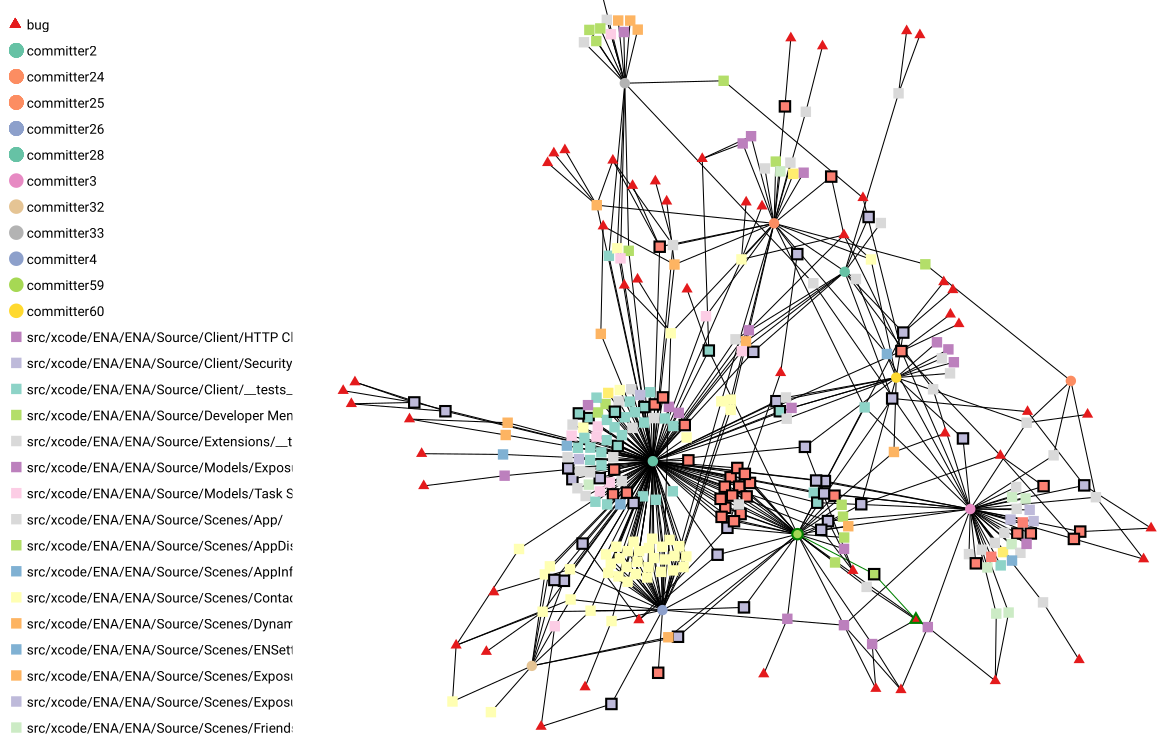
These source code areas, like Knowledge Islands and Balances, can be made visually visible as Knowledge Tangles (as shown in Table 1) in the network diagrams below.
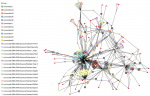 Figure 11: KI / KBs of the iOS app Q4 2020, Risk and Exposure Submission files outlined
On the one hand, Figure 11 shows Knowledge Islands/Balances of the iOS app in Q4/2020 in connection with bugs as red triangles. A few source files are affected by three or two bugs, several by one bug, but the vast majority (approx. 95%) are free of them.
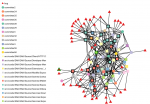
Figure 12: Knowledge Tangles of the iOS-App Q4/2020, Risk und Exposure Submission Source Files are outlined in dark colour
In contrast, Figure 12 shows a large Knowledge Tangle for the iOS app, which is heavily affected by bugs compared to Knowledge Islands and Balances. In both diagrams, source files from the Risk and Exposure Submission directories have a black border. It can be seen that, as assumed from the values from Table 3, they are represented to a large extent in the aforementioned Knowledge Tangle. Approx. 85% of these source code files originate from the three source code directories mentioned above and located on the right in Fig. 10 with a high Committer Friction Index.
The analysis and visualization with DETANGLE makes it impressively clear that Collective Code Ownership has shown its pitfalls and, in this case, markedly negative effects.
9. Summary and Recommendations
In this article, the authors have used an analysis of the development of the Corona-Warn-App in the period from Q2 to Q4 2020 to present ways and means by which teams and project managers can measure and monitor the relationship between development efforts and the effectiveness of knowledge distribution. The findings can be used to identify project and product risks at an early stage and to initiate appropriate countermeasures in a timely manner.
In detail, the analysis of the code history revealed that knowledge and team structures were not or hardly have been explicitly analysed. The extraordinarily inhomogeneous distribution of knowledge (Knowledge Islands) in the teams of the two sub-projects iOS app and Android app was detected and visualised with the DETANGLE software analysis suite. It seems that the principle of self-organisation of teams using reviews and giving mutual feedback was relied on only. That the hoped effect did not happen gets evident by the also very inhomogeneous distribution of the development load within the two teams.
In case of the Android app, 60% of this load was the responsibility of only one developer.
In case of the iOS app 50% was the responsibility of two developers, and this with a team size of up to 28 developers. Such ineffective knowledge and inhomogeneous effort distribution leads to general inefficiencies in the development process and also to undesirable dependencies on individual developers. The loss of one of these developers can jeopardise the quality, the launch date or the entire success of the project.
In addition to the easily ascertainable patterns of Knowledge Islands, Knowledge Balances and Knowledge Coordinators were introduced as further patterns that can be visualised via network diagrams and quantified down to the level of source code directories. This allows us to know where and when Knowledge Islands and individual coordinators represent a risk and how they can be compensated for by strengthening the Knowledge Balances.
Last but not least, it has been shown that the principle of Collective Code Ownership can even do harm and affected areas of the code can become hotspots of maintenance.
Bug fixing is a kind of non-productive work. To ensure sustainable value creation in feature development, the authors recommend conducting these analyses concurrently across iterations of development. The results would be an essential input for team reviews to initiate improvement measures or for the purpose of transparency for project managers, clients and users.
Our diagnosis that the distribution of knowledge and development efforts in the development teams of the Corona-Warn-App is problematic, possibly has been confirmed by reality, because when new features were launched, delays and functional restrictions occurred repeatedly, up to and including the failure of the app [8].
Note: The presented results and insights are only a small part of the relevant information that could have been achieved if the authors had been given open access to the development teams and to the non-public SAP JIRA projects used by the project team.
10. About the Approach
The analysis of the development of the Corona-WarnApp was carried out with the data available on GitHub as an open source project, but without the involvement of the companies commissioned with the development. For the analysis we used the DETANGLE Analysis Suite, which allows an evaluation of the GitHub issues/pull requests, the developers involved and the code changes resulting from them over the entire code history of the two apps. The data from the non-public SAP JIRA issue project could not be used. A detailed description of the procedure can be found at [3].
We focus on data resulting from changes to common source code files for new features. We do not take into account merges of the commit history that result from pull requests, as these are usually related to reviews and would “dilute” the data in terms of knowledge distribution.
Links
[1] Agile Alliance, Collective Code Ownership
https://www.agilealliance.org/glossary/collective-ownership
[2] heise developer, “Collective Code Ownership: Ein Anti-Pattern?”
https://www.heise.de/developer/artikel/Collective-Code-Ownership-Ein-Anti-Pattern-3909449.html
[3] Blog Cape of Good Code, Details of the analysis approach ("About the Approach")
https://capeofgoodcode.com/en/knowledge/corona-warn-app-on-the-way-to-critical-technical-debt
[4] JCON 2020, “Feature and Time-Based Software Analysis”
Measuring Development Effort: https://youtu.be/aD4OQScGILo?t=790
5 Minutes: 13:10 – 18:27
[5] Blog Cape of Good Code, “Cooperation and Knowledge Sharing for Remote Agile Development”
https://capeofgoodcode.com/en/knowledge/cooperation-and-knowledge-sharing-for-remote-agile-development/
[6] Blog Cape of Good Code, “Corona Warn App – On the Way to Critical Technical Debt?”
https://capeofgoodcode.com/en/knowledge/corona-warn-app-on-the-way-to-critical-technical-debt/
[7] Diffusion of Responsibility
https://web.archive.org/web/20100227092905/http://greatergood.berkeley.edu/greatergood/archive/2006fallwinter/keltnermarsh.html
[8] Handelsblatt, “Die Fehler der Corona-App offenbaren eine gefährliche Schweigsamkeit der Firmen”
https://www.handelsblatt.com/meinung/kommentare/kommentar-die-fehler-der-corona-app-offenbaren-eine-gefaehrliche-schweigsamkeit-der-firmen/26038162.html